Download CAMS Radiation Service gridded dataset
Download CAMS Radiation gridded dataset over Meteosat and Himawari fields of view |
You may download this dataset from Copernicus Atmospheric Data Store at https://ads.atmosphere.copernicus.eu/datasets/cams-gridded-solar-radiation.
If this link is out of order, a mirror is available at https://www.soda-is.com/pub/files/cams/CAMS-MSG-HIMAWARI-v4.6rev2.
Copyright: please refer to this volume as "CAMS radiation service gridded dataset 4.6 rev2 over Meteosat and Himawari fields of view, computed with McClear version 3.5 and CAMS radiation v4.6".
| Version | The current version 4.6 rev2 is available since January 2025 (May 2025 for 2025 data). Changes since version 4.6 (July 2024):
Changes since version 4.5 (July 2023):
| 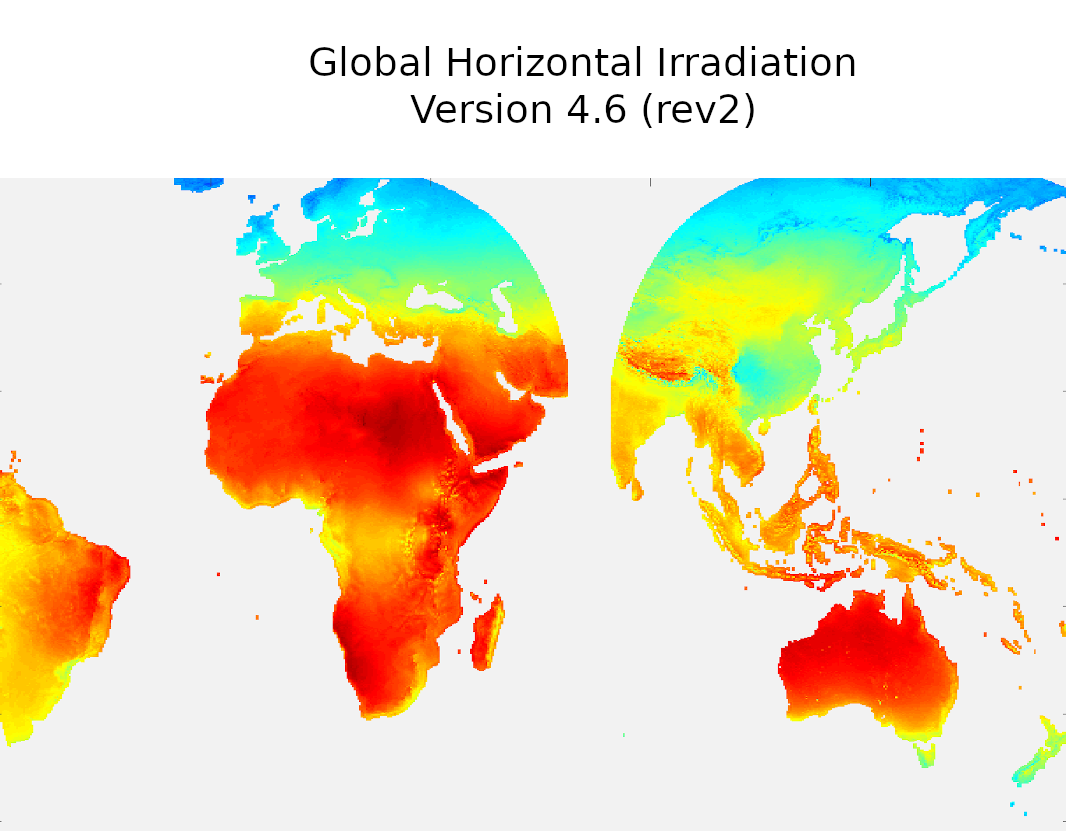 Click on the image to magnify: average GHI map over Meteosat and Himawari fields of view |
|---|---|---|
| Introduction |
| |
| Grid description | We used a grid of nb_columns*nb_lines = 3600*1800 points over the whole world with a 0.1° step. Grid:
NB: the formula to convert (lat, lon) into grid cell is:
NB: Only grid cells on land or close to sea shore were computed. Only grid cells in Meteosat and Himawari fields of view were computed:
| |
| Volume content | Each NetCDF dataset comprises up to 2976 maps, which correspond to the number of 15 min periods in 1 month (31 days). Each value in NetCDF files contains 15 min irradiation in Wh/m². The value NaN denotes a grid cell over the sea or out of MSG field of view (not computed) or a computation error. WARNING: Data are compressed in NetCDF files. In version 4.5, end users had to convert 254 and 255 values to NaN, and to multiply the other values by 1.2. Since version 4.6, this is done automatically by NetCDF library. Note: | 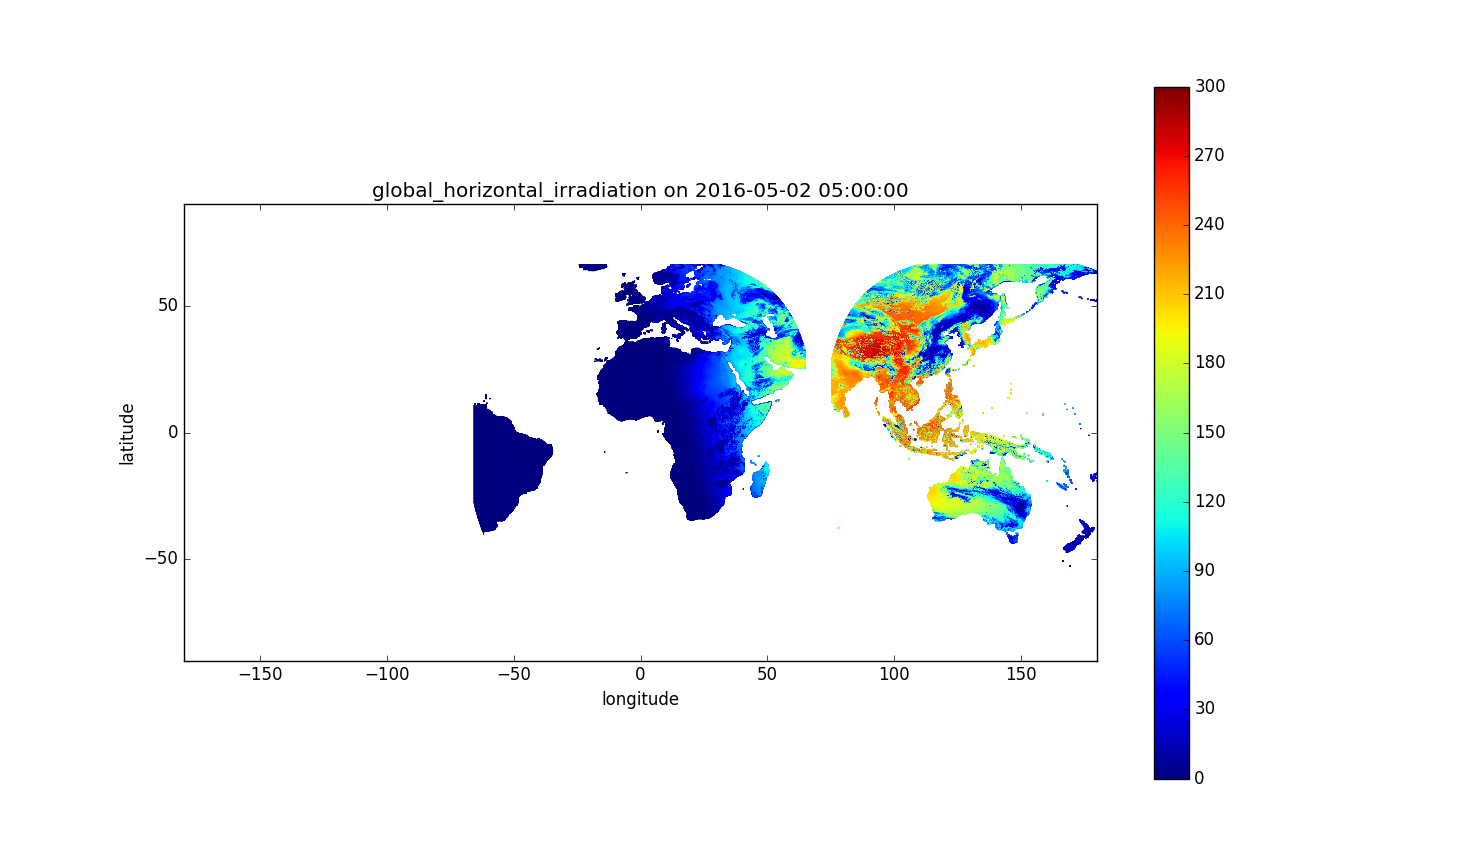 Click on the image to magnify: GHI on 2016-05-02 from 4h45 to 5h00 UT |
| Routines to read the dataset | ||