
HC3 Archives - RMI
Validation HC3v4 and HC3v5 Archives - RMI stations |
Date of the validation: 2015
Illustration: list of the stations used for the validation => |
|
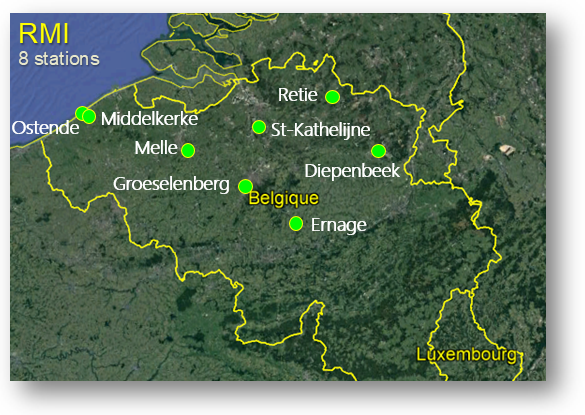
RMI stations used in this validation
(Table 1: in decreasing latitudes)
| Station | Latitude | Longitude | Altitude (m) | Period | Climate |
| Diepenbeek | 50.916 | 5.451 | 39 | 2011-11-30 to 2012-12-31 | Continental |
| Ernage | 50.583 | 4.691 | 157 | 2011-11-30 to 2012-03-31 | Continental |
| Groeselenberg | 50.800 | 4.350 | 82 | 2011-12-31 to 2012-12-31 | Continental |
| Melle | 50.976 | 3.825 | 15 | 2011-11-30 to 2012-12-31 | Continental |
| Middelkerke | 51.198 | 2.869 | 3 | 2011-11-30 to 2013-02-28 | Oceanic |
| Ostende | 51.200 | 2.867 | 2 | 2011-12-31 to 2012-12-31 | Oceanic |
| Retie | 51.222 | 5.028 | 21 | 2012-03-31 to 2012-12-31 | Continental |
| St-Katelijne | 51.076 | 4.526 | 10 | 2011-11-30 to 2012-12-31 | Continental |
GHI and DNI HC3v4 and HC3v5 validation results - monthly, daily, and hourly sampling rates
(Click on the following link to show the corresponding statistics)
Monthly GHI
|
HelioClim-3 v4 and v5 -- GHI Quality assessment results vs. measurement stations in Belgium MONTHLY SUM OF HOURLY IRRADIATION |
||||||||
| Station | Number of values |
Mean - Station - (kWh/m²) |
Bias HC3v4 (kWh/m2) (relative in %) |
Bias HC3v5 (kWh/m2) (relative in %) |
RMSE HC3v4 (kWh/m2) (relative in %) |
RMSE HC3v5 (kWh/m2) (relative in %) |
Correl. coeff. HC3v4 |
Correl. coeff. HC3v5 |
| Diepenbeek | 13 | 73.1 | -3.8 (-5.1%) | -0.3 (-0.4%) | 4.9 (6.7%) | 2.8 (3.8%) | 0.999 | 0.999 |
| Ernage | 4 | 39.4 | -3.9 (-9.8%) | -1.0 (-2.7%) | 4.5 (11.3%) | 2.0 (5.0%) | 0.997 | 0.999 |
| Groeselenberg | 12 | 82.8 | -3.7 (-4.5%) | 0.3 (0.4%) | 6.8 (8.2%) | 5.4 (6.5%) | 0.995 | 0.995 |
| Melle | 13 | 75.3 | -4.7 (-6.2%) | -1.8 (-2.4%) | 5.5 (7.3%) | 2.7 (3.6%) | 0.999 | 0.999 |
| Middelkerke | 13 | 83.1 | -2.7 (-3.3%) | -0.1 (-0.1%) | 3.8 (4.6%) | 2.7 (3.2%) | 0.999 | 0.999 |
| Ostende | 12 | 89.7 | -2.9 (-3.3%) | -1.2 (-1.3%) | 4.0 (4.4%) | 2.8 (3.1%) | 0.999 | 0.999 |
| Retie | 9 | 89.9 | -2.1 (-2.3%) | 1.3 (1.4%) | 2.8 (3.1%) | 2.4 (2.6%) | 0.999 | 1.000 |
| St-Katelijne | 13 | 75.0 | -4.2 (-5.6%) | -0.9 (-1.2%) | 5.1 (6.8%) | 2.3 (3.1%) | 0.999 | 0.999 |
| Uccle | 14 | 73.4 | -3.9 (-5.3%) | -0.6 (-0.8%) | 6.8 (9.3%) | 5.3 (7.2%) | 0.996 | 0.995 |
Daily GHI
|
HelioClim-3 v4 and v5 -- GHI Quality assessment results vs. measurement stations in Belgium DAILY SUM OF HOURLY IRRADIATION |
||||||||
| Station | Number of values |
Mean - Station - (Wh/m²) |
Bias HC3v4 (Wh/m2) (relative in %) |
Bias HC3v5 (Wh/m2) (relative in %) |
RMSE HC3v4 (Wh/m2) (relative in %) |
RMSE HC3v5 (Wh/m2) (relative in %) |
Correl. coeff. HC3v4 |
Correl. coeff. HC3v5 |
| Diepenbeek | 363 | 2617.7 | -134.8 (-5.1%) | -11.7 (-0.4%) | 394.8 (15.1%) | 377.6 (14.4%) | 0.984 | 0.985 |
| Ernage | 116 | 1358.7 | -133.3 (-9.8%) | -36.1 (-2.7%) | 241.4 (17.8%) | 157.6 (11.6%) | 0.991 | 0.994 |
| Groeselenberg | 354 | 2806.1 | -125.4 (-4.5%) | 10.1 (0.4%) | 365.9 (13.0%) | 353.5 (12.6%) | 0.986 | 0.986 |
| Melle | 373 | 2624.8 | -162.7 (-6.2%) | -63.6 (-2.4%) | 370.3 (14.1%) | 328.9 (12.5%) | 0.987 | 0.988 |
| Middelkerke | 380 | 2843.2 | -93.1 (-3.3%) | -4.0 (-0.1%) | 280.9 (9.9%) | 260.2 (9.1%) | 0.993 | 0.993 |
| Ostende | 359 | 2998.9 | -97.8 (-3.3%) | -38.8 (-1.3%) | 289.3 (9.6%) | 264.1 (8.8%) | 0.992 | 0.993 |
| Retie | 256 | 3160.5 | -72.5 (-2.3%) | 44.4 (1.4%) | 396.0 (12.5%) | 399.4 (12.6%) | 0.983 | 0.984 |
| St-Katelijne | 367 | 2657.4 | -147.9 (-5.6%) | -32.2 (-1.2%) | 375.3 (14.1%) | 339.3 (12.8%) | 0.986 | 0.988 |
| Uccle | 402 | 2554.6 | -136.6 (-5.3%) | -20.4 (-0.8%) | 361.9 (14.2%) | 344.3 (13.5%) | 0.987 | 0.986 |
Hourly GHI
|
HelioClim-3 v4 and v5 -- GHI Quality assessment results vs. measurement stations in Belgium HOURLY IRRADIATION |
||||||||
| Station | Number of values |
Mean - Station - (Wh/m²) |
Bias HC3v4 (Wh/m2) (relative in %) |
Bias HC3v5 (Wh/m2) (relative in %) |
RMSE HC3v4 (Wh/m2) (relative in %) |
RMSE HC3v5 (Wh/m2) (relative in %) |
Correl. coeff. HC3v4 |
Correl. coeff. HC3v5 |
| Diepenbeek | 3279 | 289.8 | -14.9 (-5.1%) | -1.3 (-0.4%) | 71.6 (24.7%) | 70.9 (24.5%) | 0.941 | 0.943 |
| Ernage | 737 | 213.9 | -21.0 (-9.8%) | -5.7 (-2.7%) | 43.7 (20.5%) | 33.7 (15.8%) | 0.975 | 0.979 |
| Groeselenberg | 3352 | 296.4 | -13.2 (-4.5%) | 1.1 (0.4%) | 64.0 (21.6%) | 64.2 (21.7%) | 0.954 | 0.954 |
| Melle | 3337 | 293.4 | -18.2 (-6.2%) | -7.1 (-2.4%) | 64.2 (21.9%) | 61.8 (21.1%) | 0.953 | 0.955 |
| Middelkerke | 3467 | 311.6 | -10.2 (-3.3%) | -0.4 (-0.1%) | 56.0 (18.0%) | 54.4 (17.5%) | 0.969 | 0.970 |
| Ostende | 3402 | 316.5 | -10.3 (-3.3%) | -4.1 (-1.3%) | 56.5 (17.9%) | 54.7 (17.3%) | 0.968 | 0.970 |
| Retie | 2572 | 314.6 | -7.2 (-2.3%) | 4.4 (1.4%) | 71.8 (22.8%) | 72.4 (23.0%) | 0.940 | 0.943 |
| St-Katelijne | 3320 | 293.8 | -16.3 (-5.6%) | -3.6 (-1.2%) | 72.3 (24.6%) | 70.1 (23.8%) | 0.940 | 0.943 |
| Uccle | 3584 | 286.5 | -15.3 (-5.3%) | -2.3 (-0.8%) | 69.4 (24.2%) | 69.3 (24.2%) | 0.945 | 0.945 |