
CAMS Rad - BSRN
Validation CAMS Radiation Service - BSRN stations |
Date of the validation: June 2021
Illustration: list of the BSRN stations used for the validation => |
|
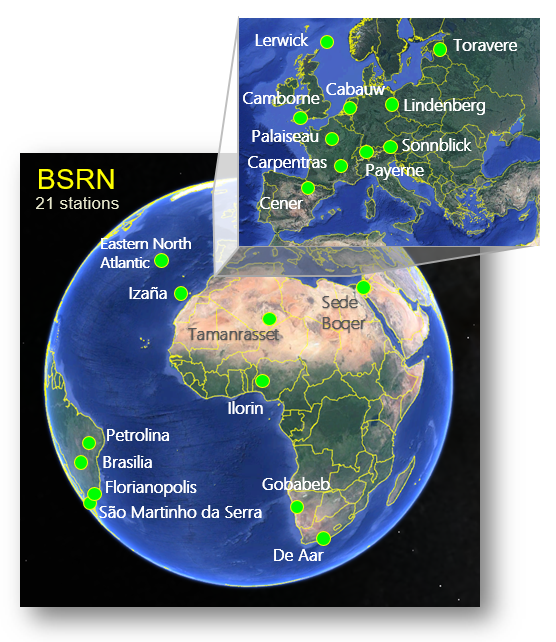
BSRN stations used in this validation
(Table 1: in decreasing latitudes)
| Station | Code | Country | Latitude | Longitude | Altitude (m) | Period | Type of Climate |
| Lerwick | LER | Scotland | 60.139 | -1.185 | 80 | 2004-02-01 to 2017-12-31 | Oceanic |
| Toravere | TOR | Estonia | 58.254 | 26.462 | 70 | 2004-02-01 to 2020-12-31 | Continental |
| Lindenberg | LIN | Germany | 52.210 | 14.122 | 125 | 2004-02-01 to 2017-12-31 | Continental |
| Cabauw | CAB | The Netherlands | 51.971 | 4.927 | 0 | 2005-01-01 to 2020-12-31 | Oceanic |
| Camborne | CAM | United Kingdom | 50.217 | -5.317 | 88 | 2004-02-01 to 2017-12-31 | Oceanic |
| Palaiseau | PAL | France | 48.713 | 2.208 | 156 | 2004-02-01 to 2019-12-31 | Continental |
| Sonnblick | SON | Austria | 47.054 | 12.958 | 3109 | 2013-01-01 to 2020-12-31 | Montaneous |
| Payerne | PAY | Switzerland | 46.815 | 6.944 | 491 | 2004-02-01 to 2020-12-31 | Continental |
| Carpentras | CAR | France | 44.083 | 5.059 | 100 | 2004-02-01 to 2018-12-31 | Mediterranean |
| Cener | CEN | Spain | 42.816 | -1.601 | 471 | 2009-01-01 to 2020-12-31 | Oceanic |
| Eastern North Atlantic, Azores | ENA | Spain | 39.091 | -28.029 | 15 | 2013-01-01 to 2015-12-31 | Oceanic |
| Sede Boqer | SBO | Israel | 30.860 | 34.779 | 500 | 2004-02-01 to 2012-12-31 | Desertic |
| Tamanrasset | TAM | Algeria | 22.790 | 5.529 | 1385 | 2004-02-01 to 2020-12-31 | Desertic |
| Petrolina | PTR | Brazil | -9.068 | -40.319 | 387 | 2007-01-01 to 2019-12-31 | Subtropical |
| Brasilia | BRB | Brazil | -15.601 | -47.713 | 1023 | 2006-01-01 to 2019-12-31 | Subtropical |
| Gobabeb | GOB | Namibia | -23.561 | 15.042 | 407 | 2012-01-01 to 2020-12-31 | Desertic |
| Florianopolis | FLO | Brasilia | -27.605 | -48.523 | 11 | 2004-02-01 to 2020-12-31 | Subtropical |
| Sao Martinho da Serra | SMS | Brasilia | -29.443 | -53.823 | 489 | 2006-01-01 to 2019-12-31 | Subtropical |
| De Aar | DAA | South Africa | -30.667 | 23.993 | 1287 | 2004-02-01 to 2020-12-31 | Desertic |
GHI and DNI CAMS Radiation validation results - monthly, daily, hourly and 15 min sampling rates
(Click on the following link to show the corresponding statistics)
Monthly GHI
| CAMS-Radiation -- GHI Quality assessment results vs. the stations MONTHLY IRRADIATION |
||||||
| Station | Number of values | Mean station (kWh/m2) |
Bias (kWh/m2) (relative in %) |
STDEV (kWh/m2) (relative in %) |
RMSE (kWh/m2) (relative in %) |
Correl. coeff. |
| Lerwick | 119 | 68.14 | -2.80 (-4.11%) | 3.91 (5.74%) | 4.81 (7.06%) | 0.998 |
| Toravere | 194 | 71.48 | -3.09 (-4.32%) | 3.65 (5.11%) | 4.78 (6.69%) | 0.999 |
| Lindenberg | 167 | 89.22 | 0.79 (0.89%) | 3.25 (3.64%) | 3.34 (3.74%) | 0.999 |
| Cabauw | 183 | 87.50 | 1.20 (1.37%) | 2.63 (3.00%) | 2.89 (3.30%) | 0.999 |
| Camborne | 117 | 90.34 | 1.89 (2.10%) | 3.13 (3.46%) | 3.66 (4.05%) | 0.999 |
| Palaiseau | 164 | 97.59 | 1.72 (1.77%) | 3.11 (3.19%) | 3.56 (3.65%) | 0.999 |
| Sonnblick | 86 | 97.31 | -9.25 (-9.50%) | 17.17 (17.64%) | 19.50 (20.04%) | 0.941 |
| Payerne | 191 | 101.37 | 3.43 (3.38%) | 2.97 (2.93%) | 4.53 (4.47%) | 0.999 |
| Carpentras | 175 | 128.09 | 2.92 (2.28%) | 2.75 (2.15%) | 4.01 (3.13%) | 0.999 |
| Cener | 130 | 117.02 | 2.60 (2.22%) | 3.88 (3.31%) | 4.67 (3.99%) | 0.998 |
| ENA, Azores | 12 | 119.49 | -3.99 (-3.34%) | 2.39 (2.00%) | 4.66 (3.90%) | 0.999 |
| Sede Boqer | 100 | 168.15 | -8.12 (-4.83%) | 4.71 (2.80%) | 9.38 (5.58%) | 0.997 |
| Tamanrasset | 195 | 169.86 | -5.77 (-3.40%) | 4.52 (2.66%) | 7.33 (4.31%) | 0.993 |
| Petrolina | 112 | 148.83 | 11.51 (7.73%) | 5.05 (3.39%) | 12.57 (8.45%) | 0.987 |
| Brasilia | 100 | 144.24 | 8.14 (5.64%) | 7.63 (5.29%) | 11.15 (7.73%) | 0.964 |
| Gobabeb | 96 | 197.92 | -6.97 (-3.52%) | 3.31 (1.67%) | 7.71 (3.90%) | 0.998 |
| Florianopolis | 76 | 128.27 | 4.15 (3.23%) | 4.48 (3.49%) | 6.11 (4.76%) | 0.995 |
| Sao Martinho da Serra | 126 | 136.59 | -0.34 (-0.25%) | 3.59 (2.62%) | 3.60 (2.64%) | 0.998 |
| De Aar | 75 | 175.13 | -1.66 (-0.95%) | 3.90 (2.23%) | 4.24 (2.42%) | 0.998 |
Daily GHI
| CAMS-Radiation -- GHI Quality assessment results vs. the stations DAILY IRRADIATION |
||||||
| Station | Number of values | Mean station (Wh/m2) |
Bias (Wh/m2) (relative in %) |
STDEV (Wh/m2) (relative in %) |
RMSE (Wh/m2) (relative in %) |
Correl. coeff. |
| Lerwick | 3245 | 2505.71 | -101.33 (-4.04%) | 474.78 (18.95%) | 485.47 (19.37%) | 0.972 |
| Toravere | 5027 | 2674.08 | -107.92 (-4.04%) | 352.27 (13.17%) | 368.44 (13.78%) | 0.989 |
| Lindenberg | 5060 | 2942.74 | 26.20 (0.89%) | 296.19 (10.07%) | 297.35 (10.10%) | 0.991 |
| Cabauw | 5490 | 2907.51 | 39.84 (1.37%) | 264.67 (9.10%) | 267.65 (9.21%) | 0.993 |
| Camborne | 3499 | 3026.66 | 63.69 (2.10%) | 355.42 (11.74%) | 361.08 (11.93%) | 0.987 |
| Palaiseau | 4941 | 3234.17 | 59.69 (1.85%) | 300.40 (9.29%) | 306.27 (9.47%) | 0.991 |
| Sonnblick | 2202 | 3660.26 | -336.19 (-9.18%) | 985.12 (26.91%) | 1040.91 (28.44%) | 0.884 |
| Payerne | 5673 | 3381.15 | 115.06 (3.40%) | 328.77 (9.72%) | 348.32 (10.30%) | 0.991 |
| Carpentras | 5228 | 4293.05 | 97.75 (2.28%) | 261.75 (6.10%) | 279.41 (6.51%) | 0.994 |
| Cener | 3814 | 3953.04 | 89.59 (2.27%) | 326.43 (8.26%) | 338.50 (8.56%) | 0.991 |
| ENA, Azores | 383 | 3880.43 | -140.88 (-3.63%) | 357.19 (9.20%) | 383.97 (9.90%) | 0.986 |
| Sede Boqer | 2927 | 5698.56 | -271.94 (-4.77%) | 406.25 (7.13%) | 488.86 (8.58%) | 0.981 |
| Tamanrasset | 5296 | 5930.07 | -189.59 (-3.20%) | 396.68 (6.69%) | 439.66 (7.41%) | 0.962 |
| Petrolina | 3136 | 5408.62 | 421.48 (7.79%) | 371.11 (6.86%) | 561.57 (10.38%) | 0.960 |
| Brasilia | 2863 | 5195.37 | 272.11 (5.24%) | 551.71 (10.62%) | 615.17 (11.84%) | 0.915 |
| Gobabeb | 2877 | 6599.24 | -232.25 (-3.52%) | 228.38 (3.46%) | 325.73 (4.94%) | 0.991 |
| Florianopolis | 2305 | 4294.39 | 142.47 (3.32%) | 449.82 (10.47%) | 471.84 (10.99%) | 0.976 |
| Sao Martinho da Serra | 3792 | 4671.31 | -12.81 (-0.27%) | 390.59 (8.36%) | 390.80 (8.37%) | 0.986 |
| De Aar | 2252 | 5823.48 | -51.71 (-0.89%) | 351.19 (6.03%) | 354.98 (6.10%) | 0.987 |
Hourly GHI
| CAMS-Radiation -- GHI Quality assessment results vs. the stations HOURLY IRRADIATION |
||||||
| Station | Number of values | Mean station (Wh/m2) |
Bias (Wh/m2) (relative in %) |
STDEV (Wh/m2) (relative in %) |
RMSE (Wh/m2) (relative in %) |
Correl. coeff. |
| Lerwick | 35437 | 229.46 | -9.32 (-4.06%) | 73.49 (32.03%) | 74.08 (32.28%) | 0.924 |
| Toravere | 50104 | 262.63 | -10.14 (-3.86%) | 64.93 (24.72%) | 65.72 (25.02%) | 0.954 |
| Lindenberg | 51596 | 288.40 | 2.54 (0.88%) | 58.51 (20.29%) | 58.57 (20.31%) | 0.966 |
| Cabauw | 56428 | 283.05 | 3.87 (1.37%) | 55.25 (19.52%) | 55.39 (19.57%) | 0.969 |
| Camborne | 36920 | 286.98 | 6.01 (2.10%) | 62.83 (21.89%) | 63.11 (21.99%) | 0.963 |
| Palaiseau | 51966 | 307.53 | 5.62 (1.83%) | 58.47 (19.01%) | 58.74 (19.10%) | 0.969 |
| Sonnblick | 22911 | 355.58 | -33.41 (-9.40%) | 140.05 (39.39%) | 143.98 (40.49%) | 0.827 |
| Payerne | 59482 | 321.06 | 11.18 (3.48%) | 61.76 (19.24%) | 62.77 (19.55%) | 0.971 |
| Carpentras | 56196 | 399.32 | 9.10 (2.28%) | 48.96 (12.26%) | 49.79 (12.47%) | 0.984 |
| Cener | 41417 | 365.60 | 8.27 (2.26%) | 61.48 (16.82%) | 62.03 (16.97%) | 0.974 |
| ENA, Azores | 4191 | 359.69 | -13.63 (-3.79%) | 64.09 (17.82%) | 65.53 (18.22%) | 0.969 |
| Sede Boqer | 30013 | 557.40 | -26.57 (-4.77%) | 73.55 (13.20%) | 78.20 (14.03%) | 0.968 |
| Tamanrasset | 59993 | 540.52 | -17.83 (-3.30%) | 65.04 (12.03%) | 67.44 (12.48%) | 0.979 |
| Petrolina | 34248 | 499.64 | 38.69 (7.74%) | 79.17 (15.84%) | 88.11 (17.64%) | 0.966 |
| Brasilia | 32098 | 471.50 | 28.12 (5.96%) | 123.67 (26.23%) | 126.82 (26.90%) | 0.912 |
| Gobabeb | 31849 | 596.16 | -20.98 (-3.52%) | 38.74 (6.50%) | 44.06 (7.39%) | 0.992 |
| Florianopolis | 25488 | 388.30 | 13.33 (3.43%) | 88.13 (22.70%) | 89.13 (22.95%) | 0.954 |
| Sao Martinho da Serra | 41804 | 424.79 | -1.21 (-0.29%) | 75.85 (17.86%) | 75.86 (17.86%) | 0.969 |
| De Aar | 23857 | 550.15 | -4.78 (-0.87%) | 56.47 (10.26%) | 56.67 (10.30%) | 0.983 |
15 min GHI
| CAMS-Radiation -- GHI Quality assessment results vs. the stations 15 MIN IRRADIATION |
||||||
| Station | Number of values | Mean station (Wh/m2) |
Bias (Wh/m2) (relative in %) |
STDEV (Wh/m2) (relative in %) |
RMSE (Wh/m2) (relative in %) |
Correl. coeff. |
| Lerwick | 131306 | 62.16 | -2.53 (-4.07%) | 23.33 (37.54%) | 23.47 (37.76%) | 0.881 |
| Toravere | 187324 | 74.03 | -3.20 (-4.32%) | 22.93 (30.97%) | 23.15 (31.27%) | 0.916 |
| Lindenberg | 192695 | 77.32 | 0.69 (0.89%) | 21.06 (27.24%) | 21.08 (27.26%) | 0.931 |
| Cabauw | 209055 | 76.59 | 1.05 (1.37%) | 20.22 (26.39%) | 20.24 (26.43%) | 0.935 |
| Camborne | 136859 | 77.53 | 1.62 (2.09%) | 21.19 (27.33%) | 21.25 (27.41%) | 0.933 |
| Palaiseau | 193587 | 82.68 | 1.52 (1.84%) | 21.42 (25.91%) | 21.48 (25.98%) | 0.935 |
| Sonnblick | 86432 | 98.02 | -9.39 (-9.58%) | 40.79 (41.61%) | 41.86 (42.70%) | 0.769 |
| Payerne | 220523 | 88.14 | 2.97 (3.37%) | 21.30 (24.17%) | 21.51 (24.40%) | 0.946 |
| Carpentras | 209740 | 107.06 | 2.44 (2.28%) | 16.74 (15.63%) | 16.91 (15.80%) | 0.968 |
| Cener | 153625 | 99.02 | 2.20 (2.22%) | 21.60 (21.82%) | 21.72 (21.93%) | 0.947 |
| ENA, Azores | 15776 | 97.72 | -3.97 (-4.06%) | 22.17 (22.69%) | 22.53 (23.05%) | 0.938 |
| Sede Boqer | 116611 | 145.94 | -7.05 (-4.83%) | 22.02 (15.09%) | 23.12 (15.84%) | 0.948 |
| Tamanrasset | 224732 | 147.39 | -5.01 (-3.40%) | 21.85 (14.83%) | 22.42 (15.21%) | 0.957 |
| Petrolina | 130123 | 133.68 | 10.27 (7.68%) | 27.80 (20.80%) | 29.63 (22.17%) | 0.923 |
| Brasilia | 121842 | 126.50 | 7.65 (6.05%) | 40.62 (32.11%) | 41.33 (32.67%) | 0.846 |
| Gobabeb | 120192 | 158.08 | -5.56 (-3.52%) | 12.87 (8.14%) | 14.02 (8.87%) | 0.985 |
| Florianopolis | 95588 | 103.81 | 3.60 (3.46%) | 28.54 (27.50%) | 28.77 (27.71%) | 0.923 |
| Sao Martinho da Serra | 156411 | 114.24 | -0.32 (-0.28%) | 26.02 (22.78%) | 26.03 (22.78%) | 0.940 |
| De Aar | 90232 | 146.38 | -1.25 (-0.86%) | 20.32 (13.88%) | 20.36 (13.91%) | 0.961 |
Monthly DNI
| CAMS-Radiation -- DNI Quality assessment results vs. the stations MONTHLY IRRADIATION |
||||||
| Station | Number of values | Mean station (kWh/m2) |
Bias (kWh/m2) (relative in %) |
STDEV (kWh/m2) (relative in %) |
RMSE (kWh/m2) (relative in %) |
Correl. coeff. |
| Lerwick | 95 | 43.64 | -1.83 (-4.19%) | 6.09 (13.95%) | 6.36 (14.56%) | 0.979 |
| Toravere | 194 | 75.17 | -7.73 (-10.28%) | 9.37 (12.47%) | 12.15 (16.16%) | 0.993 |
| Lindenberg | 167 | 79.31 | 1.11 (1.40%) | 5.30 (6.68%) | 5.42 (6.83%) | 0.995 |
| Cabauw | 183 | 73.19 | 5.74 (7.84%) | 5.00 (6.84%) | 7.61 (10.40%) | 0.995 |
| Camborne | 106 | 69.68 | 7.60 (10.90%) | 7.79 (11.18%) | 10.88 (15.62%) | 0.992 |
| Palaiseau | 157 | 84.10 | 5.88 (7.00%) | 5.76 (6.85%) | 8.24 (9.79%) | 0.993 |
| Sonnblick | 86 | 81.29 | 10.66 (13.11%) | 24.65 (30.33%) | 26.86 (33.04%) | 0.832 |
| Payerne | 184 | 94.10 | 10.53 (11.19%) | 6.88 (7.32%) | 12.58 (13.37%) | 0.993 |
| Carpentras | 175 | 149.24 | 5.23 (3.51%) | 5.56 (3.73%) | 7.64 (5.12%) | 0.996 |
| Cener | 130 | 117.02 | 5.26 (4.49%) | 6.06 (5.18%) | 8.02 (6.86%) | 0.994 |
| ENA, Azores | 13 | 90.86 | -12.64 (-13.91%) | 3.67 (4.04%) | 13.16 (14.48%) | 0.997 |
| Sede Boqer | 98 | 180.76 | -32.21 (-17.82%) | 12.81 (7.09%) | 34.66 (19.17%) | 0.976 |
| Tamanrasset | 165 | 164.89 | 2.37 (1.43%) | 18.29 (11.09%) | 18.44 (11.18%) | 0.932 |
| Petrolina | 96 | 123.25 | 24.87 (20.18%) | 28.29 (22.96%) | 37.67 (30.56%) | 0.693 |
| Brasilia | 77 | 128.34 | 15.85 (12.35%) | 8.31 (6.47%) | 17.89 (13.94%) | 0.986 |
| Gobabeb | 96 | 234.60 | -20.06 (-8.55%) | 10.42 (4.44%) | 22.60 (9.64%) | 0.954 |
| Florianopolis | 71 | 104.12 | 9.30 (8.93%) | 7.52 (7.22%) | 11.96 (11.49%) | 0.973 |
| Sao Martinho da Serra | 82 | 119.70 | 8.30 (6.93%) | 22.93 (19.15%) | 24.38 (20.37%) | 0.882 |
| De Aar | 69 | 221.24 | -3.44 (-1.55%) | 7.87 (3.56%) | 8.58 (3.88%) | 0.985 |
Daily DNI
| CAMS-Radiation -- DNI Quality assessment results vs. the stations DAILY IRRADIATION |
||||||
| Station | Number of values | Mean station (Wh/m2) |
Bias (Wh/m2) (relative in %) |
STDEV (Wh/m2) (relative in %) |
RMSE (Wh/m2) (relative in %) |
Correl. coeff. |
| Lerwick | 2595 | 1604.09 | -65.41 (-4.08%) | 786.36 (49.02%) | 789.08 (49.19%) | 0.927 |
| Toravere | 5043 | 2800.95 | -276.28 (-9.86%) | 657.11 (23.46%) | 712.83 (25.45%) | 0.981 |
| Lindenberg | 5022 | 2633.98 | 36.14 (1.37%) | 543.48 (20.63%) | 544.68 (20.68%) | 0.982 |
| Cabauw | 5454 | 2445.53 | 191.82 (7.84%) | 544.41 (22.26%) | 577.21 (23.60%) | 0.979 |
| Camborne | 3157 | 2362.63 | 254.52 (10.77%) | 664.01 (28.10%) | 711.12 (30.10%) | 0.970 |
| Palaiseau | 4713 | 2807.22 | 196.11 (6.99%) | 561.66 (20.01%) | 594.91 (21.19%) | 0.980 |
| Sonnblick | 2268 | 3022.94 | 366.87 (12.14%) | 2018.92 (66.79%) | 2051.98 (67.88%) | 0.802 |
| Payerne | 4897 | 3470.04 | 382.09 (11.01%) | 721.12 (20.78%) | 816.09 (23.52%) | 0.975 |
| Carpentras | 5218 | 5014.25 | 175.15 (3.49%) | 629.90 (12.56%) | 653.80 (13.04%) | 0.982 |
| Cener | 3832 | 3950.74 | 175.88 (4.45%) | 642.08 (16.25%) | 665.73 (16.85%) | 0.981 |
| ENA, Azores | 385 | 3154.01 | -447.59 (-14.19%) | 720.14 (22.83%) | 847.90 (26.88%) | 0.972 |
| Sede Boqer | 2808 | 6255.83 | -1105.27 (-17.67%) | 998.94 (15.97%) | 1489.80 (23.81%) | 0.919 |
| Tamanrasset | 4297 | 5892.99 | 111.97 (1.90%) | 1172.60 (19.90%) | 1177.93 (19.99%) | 0.900 |
| Petrolina | 2663 | 4915.51 | 997.45 (20.29%) | 1427.86 (29.05%) | 1741.75 (35.43%) | 0.817 |
| Brasilia | 2198 | 4558.69 | 561.04 (12.31%) | 1012.14 (22.20%) | 1157.24 (25.39%) | 0.925 |
| Gobabeb | 2870 | 7834.28 | -669.56 (-8.55%) | 666.42 (8.51%) | 944.68 (12.06%) | 0.944 |
| Florianopolis | 2154 | 3499.81 | 312.94 (8.94%) | 863.01 (24.66%) | 918.00 (26.23%) | 0.959 |
| Sao Martinho da Serra | 2491 | 4655.31 | 293.93 (6.31%) | 1159.84 (24.91%) | 1196.50 (25.70%) | 0.940 |
| De Aar | 2062 | 7391.24 | -112.06 (-1.52%) | 827.71 (11.20%) | 835.26 (11.30%) | 0.962 |
Hourly DNI
| CAMS-Radiation -- DNI Quality assessment results vs. the stations HOURLY IRRADIATION |
||||||
| Station | Number of values | Mean station (Wh/m2) |
Bias (Wh/m2) (relative in %) |
STDEV (Wh/m2) (relative in %) |
RMSE (Wh/m2) (relative in %) |
Correl. coeff. |
| Lerwick | 28101 | 148.86 | -6.01 (-4.04%) | 122.57 (82.34%) | 122.72 (82.44%) | 0.855 |
| Toravere | 50303 | 277.28 | -26.90 (-9.70%) | 115.47 (41.64%) | 118.56 (42.76%) | 0.933 |
| Lindenberg | 50610 | 260.17 | 3.83 (1.47%) | 103.01 (39.59%) | 103.08 (39.62%) | 0.937 |
| Cabauw | 55736 | 239.14 | 18.75 (7.84%) | 99.33 (41.54%) | 101.09 (42.27%) | 0.937 |
| Camborne | 33101 | 225.74 | 24.34 (10.78%) | 109.03 (48.30%) | 111.71 (49.49%) | 0.925 |
| Palaiseau | 49540 | 266.59 | 18.68 (7.01%) | 103.24 (38.73%) | 104.92 (39.36%) | 0.939 |
| Sonnblick | 23540 | 293.38 | 35.99 (12.27%) | 286.95 (97.81%) | 289.19 (98.57%) | 0.706 |
| Payerne | 52407 | 327.68 | 36.20 (11.05%) | 125.91 (38.42%) | 131.01 (39.98%) | 0.928 |
| Carpentras | 56075 | 466.53 | 16.27 (3.49%) | 104.20 (22.34%) | 105.47 (22.61%) | 0.952 |
| Cener | 41249 | 366.76 | 16.62 (4.53%) | 114.09 (31.11%) | 115.29 (31.44%) | 0.943 |
| ENA, Azores | 4113 | 300.87 | -43.71 (-14.53%) | 124.65 (41.43%) | 132.09 (43.90%) | 0.926 |
| Sede Boqer | 28391 | 614.32 | -106.12 (-17.27%) | 169.17 (27.54%) | 199.70 (32.51%) | 0.842 |
| Tamanrasset | 48092 | 556.34 | 7.82 (1.41%) | 150.82 (27.11%) | 151.02 (27.15%) | 0.899 |
| Petrolina | 29327 | 447.56 | 89.80 (20.06%) | 187.18 (41.82%) | 207.60 (46.39%) | 0.823 |
| Brasilia | 23905 | 427.23 | 56.69 (13.27%) | 177.97 (41.66%) | 186.78 (43.72%) | 0.856 |
| Gobabeb | 31731 | 708.82 | -60.43 (-8.53%) | 101.49 (14.32%) | 118.12 (16.66%) | 0.946 |
| Florianopolis | 23750 | 317.47 | 28.96 (9.12%) | 148.12 (46.66%) | 150.92 (47.54%) | 0.910 |
| Sao Martinho da Serra | 26883 | 432.21 | 29.99 (6.94%) | 170.47 (39.44%) | 173.08 (40.05%) | 0.889 |
| De Aar | 21987 | 690.93 | -9.92 (-1.44%) | 119.03 (17.23%) | 119.44 (17.29%) | 0.940 |
15 min DNI
| CAMS-Radiation -- DNI Quality assessment results vs. the stations 15 MIN IRRADIATION |
||||||
| Station | Number of values | Mean station (Wh/m2) |
Bias (Wh/m2) (relative in %) |
STDEV (Wh/m2) (relative in %) |
RMSE (Wh/m2) (relative in %) |
Correl. coeff. |
| Lerwick | 104125 | 40.35 | -1.61 (-3.98%) | 39.28 (97.35%) | 39.32 (97.44%) | 0.800 |
| Toravere | 187995 | 77.57 | -7.97 (-10.28%) | 39.50 (50.92%) | 40.30 (51.95%) | 0.889 |
| Lindenberg | 188877 | 70.12 | 0.98 (1.40%) | 34.68 (49.46%) | 34.70 (49.48%) | 0.898 |
| Cabauw | 206336 | 64.91 | 5.09 (7.84%) | 33.72 (51.95%) | 34.11 (52.54%) | 0.896 |
| Camborne | 122649 | 61.02 | 6.59 (10.80%) | 35.77 (58.62%) | 36.38 (59.61%) | 0.885 |
| Palaiseau | 184523 | 71.79 | 5.05 (7.03%) | 35.00 (48.76%) | 35.36 (49.26%) | 0.899 |
| Sonnblick | 88444 | 80.11 | 10.16 (12.69%) | 82.06 (102.44%) | 82.69 (103.22%) | 0.664 |
| Payerne | 196990 | 89.25 | 9.95 (11.15%) | 40.60 (45.49%) | 41.80 (46.83%) | 0.891 |
| Carpentras | 209294 | 125.07 | 4.37 (3.50%) | 33.31 (26.63%) | 33.60 (26.86%) | 0.923 |
| Cener | 152817 | 99.55 | 4.47 (4.49%) | 37.91 (38.08%) | 38.17 (38.34%) | 0.907 |
| ENA, Azores | 15463 | 83.16 | -12.54 (-15.08%) | 41.54 (49.96%) | 43.40 (52.18%) | 0.877 |
| Sede Boqer | 110646 | 162.34 | -28.90 (-17.80%) | 48.83 (30.08%) | 56.74 (34.95%) | 0.775 |
| Tamanrasset | 181904 | 150.83 | 2.10 (1.39%) | 44.31 (29.37%) | 44.36 (29.41%) | 0.852 |
| Petrolina | 110727 | 119.63 | 24.23 (20.25%) | 56.22 (47.00%) | 61.22 (51.18%) | 0.752 |
| Brasilia | 91289 | 115.23 | 15.92 (13.81%) | 56.54 (49.07%) | 58.74 (50.98%) | 0.782 |
| Gobabeb | 119817 | 187.96 | -16.07 (-8.55%) | 31.05 (16.52%) | 34.96 (18.60%) | 0.905 |
| Florianopolis | 88886 | 84.96 | 7.84 (9.22%) | 45.62 (53.70%) | 46.29 (54.49%) | 0.874 |
| Sao Martinho da Serra | 101461 | 115.99 | 8.74 (7.53%) | 52.04 (44.87%) | 52.77 (45.49%) | 0.843 |
| De Aar | 83236 | 184.14 | -2.63 (-1.43%) | 38.51 (20.91%) | 38.60 (20.96%) | 0.892 |
Validation of previous versions of CAMS Radiation Service:
Validation of CAMS Radiation Service 3.2 against 21 BSRN stations (May 2019)