Water vapor and spectral answer of sensors
link between Water vapor content of the atmosphere and the spectral answer of sensors |
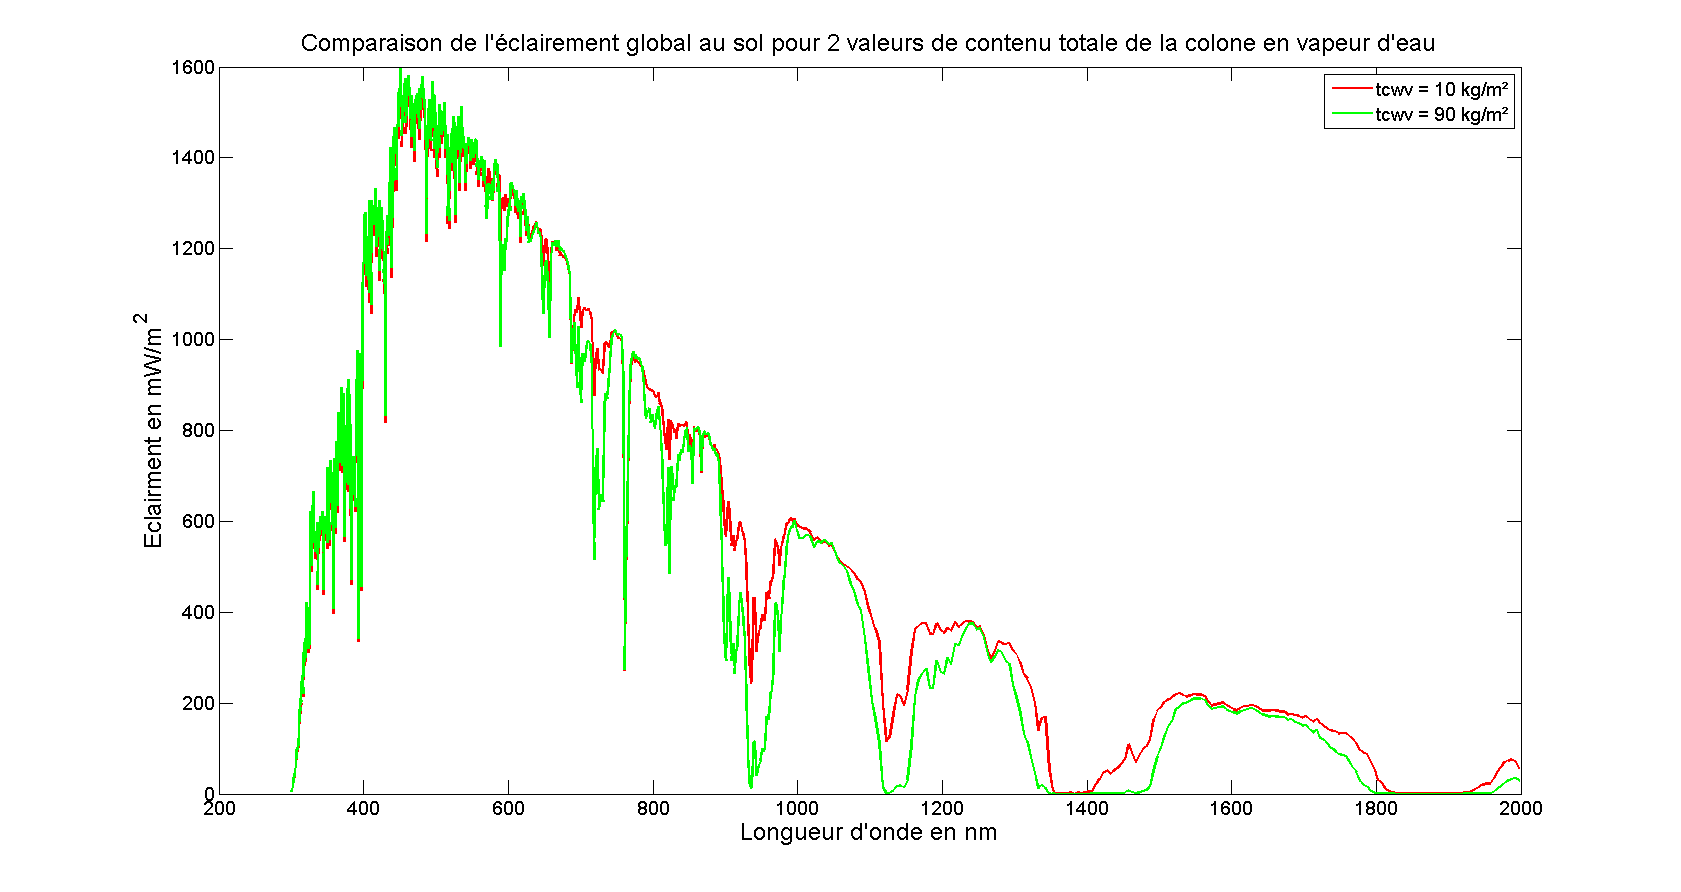
Simulation of the spectral distribution of irradiance ("éclairement" in French) in the case of the 'dry' atmosphere (red curve) and with a high level of water vapor content (green curve).

This graph demonstrates the strong influence of water vapor beyond 600 nm, and the strong dependance with the wavelength.
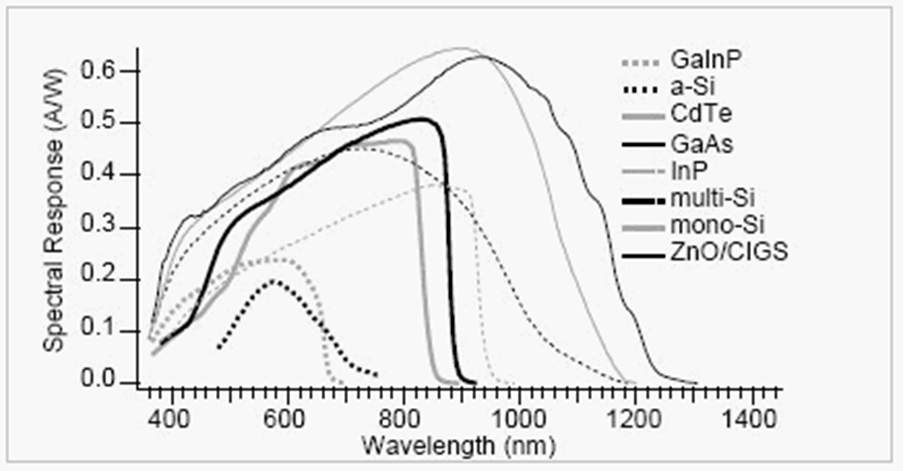
The next graph depicts the spectral answer of sensors:

The super-imposition of the two graphs informs on potential issues. For instance, a sensor with a maximum between 900 and 1000 nm, or between 1000 and 1300 nm, will give a cell very sensitive to the water vapor contained in the atmosphere.
