
Anomalies
solar radiation ANOMALy MAPs : MONTHLY COMPARISON with averagePresentation - Demonstration - Service Principle - Methodology - Projects |
Demonstration : Last month Global Horizontal Irradiation (GHI) anomalies over France
SoDa provides Global Horizontal Irradiation monthly anomalies in comparison to the period 2005-2019 for each France territory district.This is built using HelioClim-3 solar radiation database.
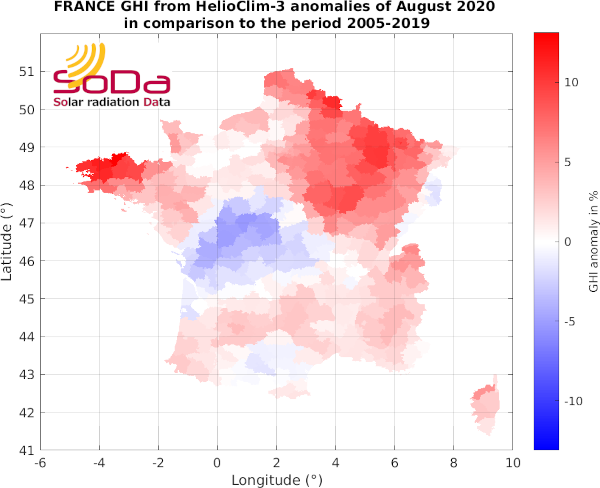 |
This map represents August 2020 monthly GHI anomalies for each France district in comparison to the average August month for the 2005 to 2019 period. |
||
|
|
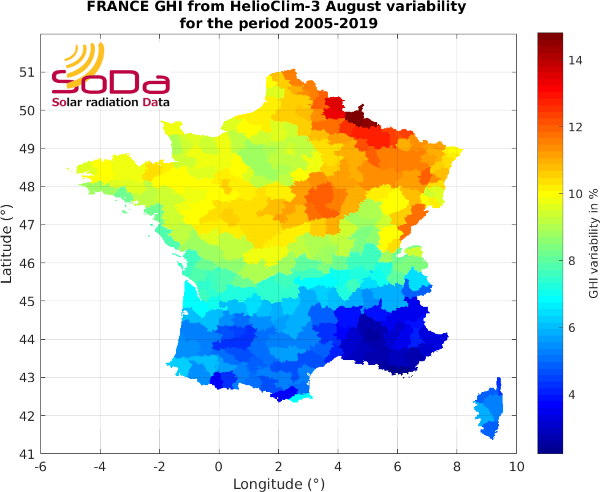
This map represents the Coefficient of Variation (CoV) in % over each districts (circonscriptions) for August over the whole period 2005-2019. |
||
GHI Anomaly and variability of previous months
January 2020
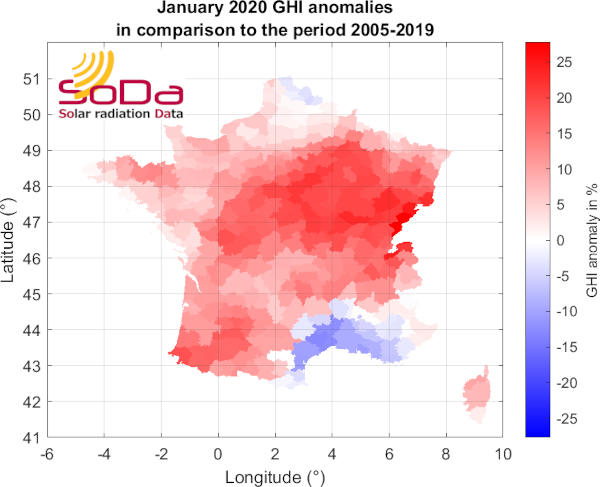 |
This map represents the January 2020 monthly GHI anomalies for each France district in comparison to the average January month for the 2005 to 2019 period. |
||
|
|
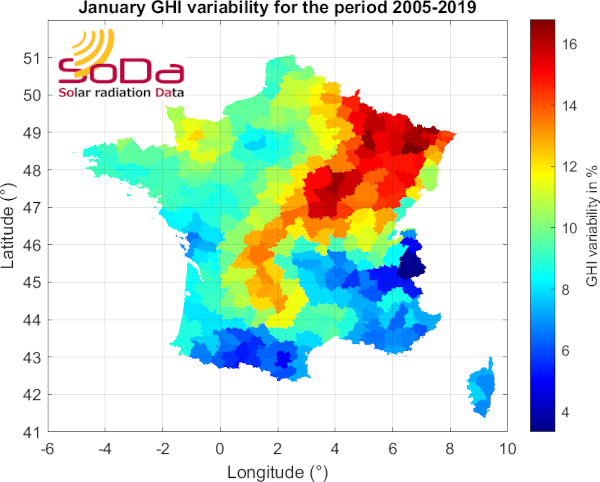
This map represents the Coefficient of Variation (CoV) in % over each districts (circonscriptions) for January over the whole period 2005-2019. |
||
February 2020
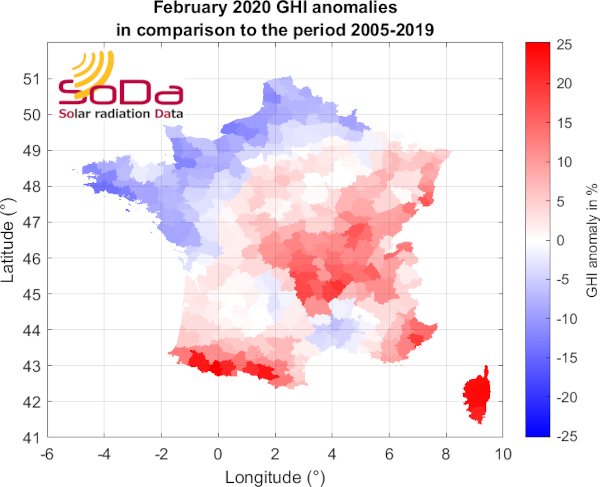 |
This map represents the February 2020 monthly GHI anomalies for each France district in comparison to the average February month for the 2005 to 2019 period. |
||
|
|
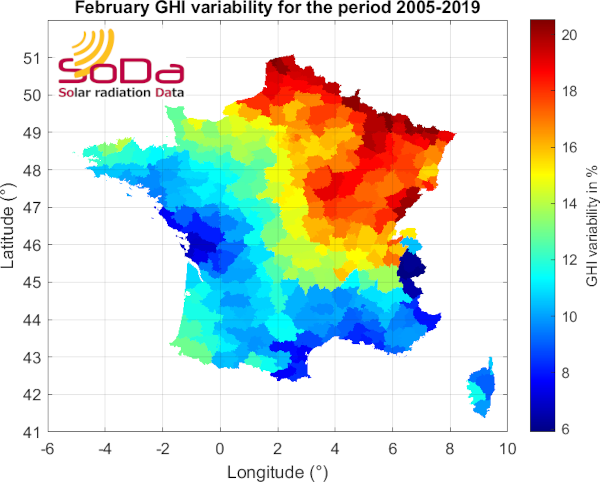
This map represents the Coefficient of Variation (CoV) in % over each districts (circonscriptions) for February over the whole period 2005-2019. |
||
March 2020
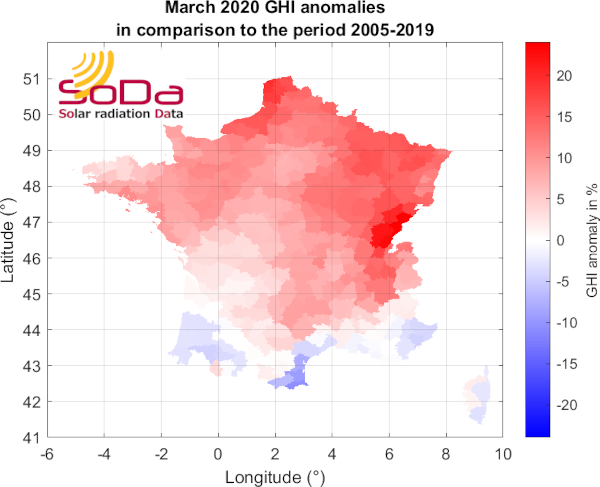 |
This map represents the March 2020 monthly GHI anomalies for each France district in comparison to the average March month for the 2005 to 2019 period. |
||
|
|
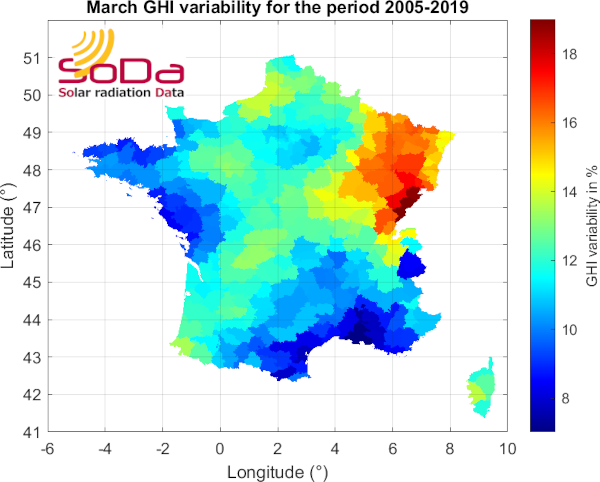
This map represents the Coefficient of Variation (CoV) in % over each districts (circonscriptions) for March over the whole period 2005-2019. |
||
April 2020
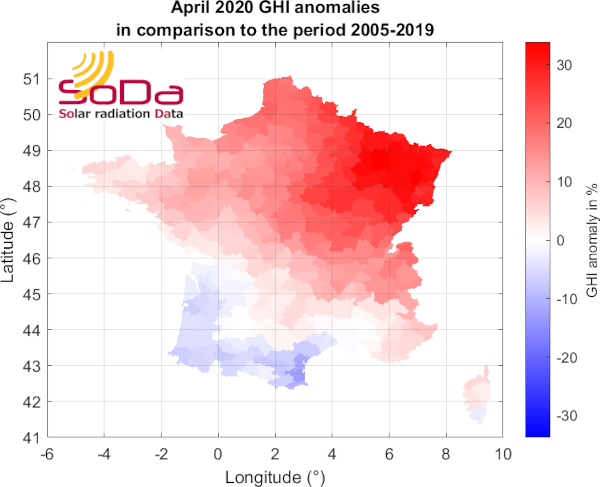 |
This map represents the April 2020 monthly GHI anomalies for each France district in comparison to the average April month for the 2005 to 2019 period. |
||
|
|
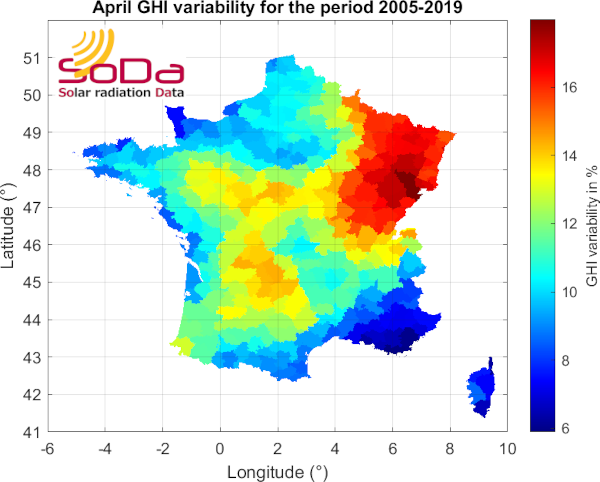
This map represents the Coefficient of Variation (CoV) in % over each districts (circonscriptions) for April over the whole period 2005-2019. |
||
May 2020
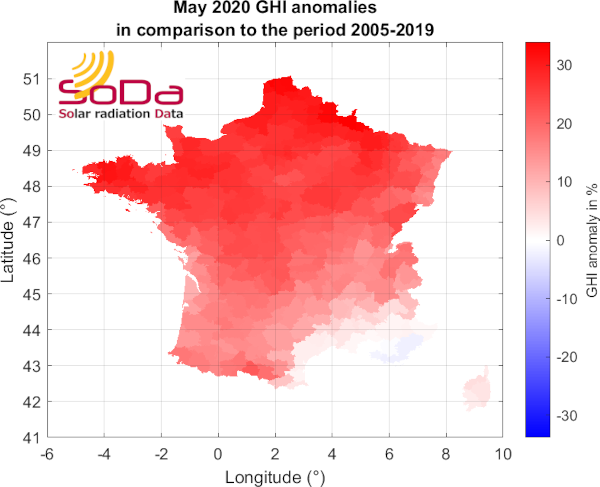 |
This map represents the May 2020 monthly GHI anomalies for each France district in comparison to the average May month for the 2005 to 2019 period. |
||
|
|
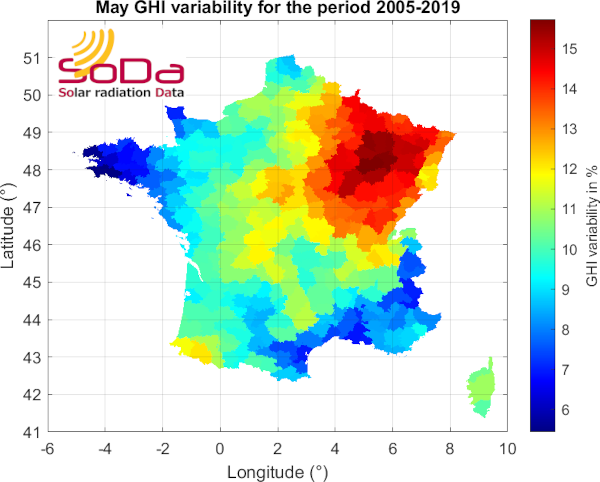
This map represents the Coefficient of Variation (CoV) in % over each districts (circonscriptions) for May over the whole period 2005-2019. |
||
June 2020
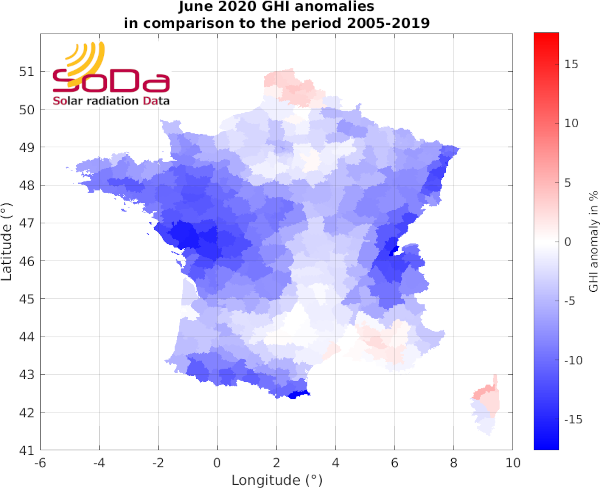 |
This map represents the June 2020 monthly GHI anomalies for each France district in comparison to the average June month for the 2005 to 2019 period. |
||
|
|
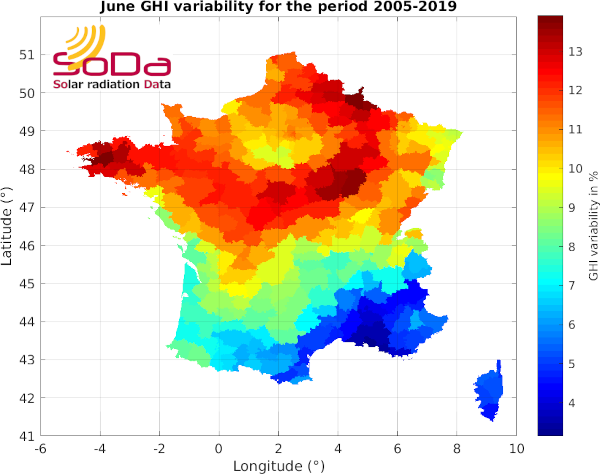
This map represents the Coefficient of Variation (CoV) in % over each districts (circonscriptions) for June over the whole period 2005-2019. |
||
July 2020
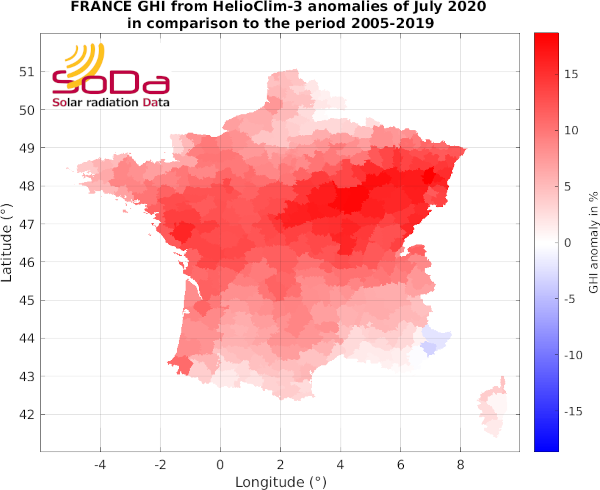 |
This map represents the July 2020 monthly GHI anomalies for each France district in comparison to the average July month for the 2005 to 2019 period. |
||
|
|
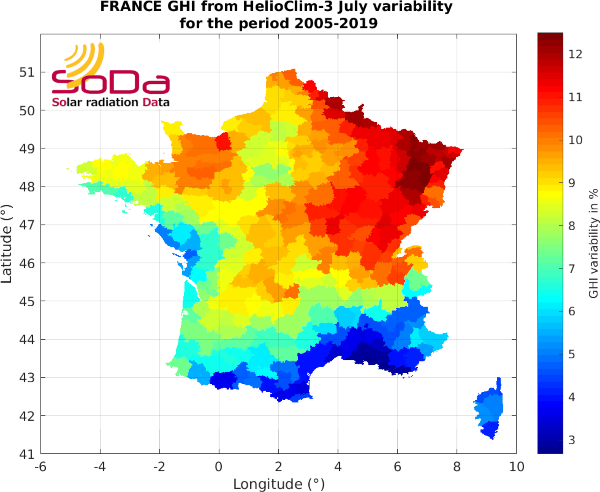
This map represents the Coefficient of Variation (CoV) in % over each districts (circonscriptions) for July over the whole period 2005-2019. |
||
Anomaly services
⇒ We can provide solar radiation anomaly maps over the territory of your choice:
- Global Horizontal Irradiation from HelioClim-3 version 5: Follow the Global Horizontal Irradiation (GHI) over Meteosat-11 coverage for each month of the current year compared to the average monthly GHI map over the whole period of availability of our most advanced satellite-derived solar radiation database HelioClim-3 version 5.
- Direct Normal Irradiation from HelioClim-3 version 5, over Meteosat-11 coverage
- Ultraviolet radiation, over Meteosat-11 coverage
- Photosynthetically Active Radiation (PAR), over Meteosat-11 coverage
⇒ We deliver anomaly maps of meteorological variables from MERRA-2 database :
- Temperature (at 2 m),
- Relative Humidity (at 2 m),
- Pressure (at 2 m),
- Wind speed and direction (at 10 m),
- Rainfall,
- Snowfall and Snow depth.
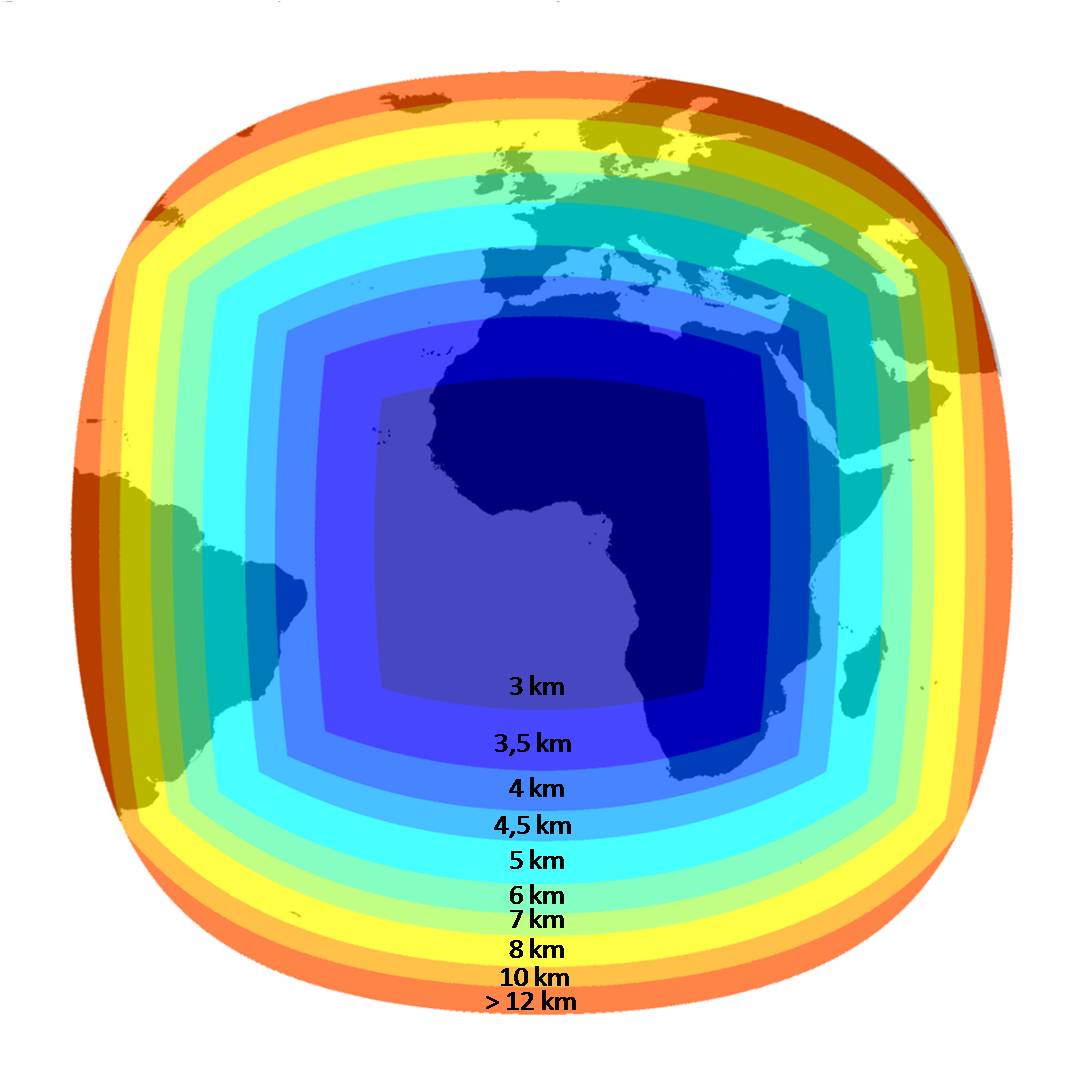
⇒ We can also explore the production of anomalies of others components relative to the atmopshere such as Global Horizontal Irradiation at clear-sky conditions, Ozone, Water vapor and Aerosol Optical Depth from CAMS service.
Methodology
Anomaly maps are built from the following steps :
- Creation of daily mean of global horizontal irradiation (GHI) for each month over the period 2005-2019 over the selected region;
- Calculation of the GHI daily mean for each districts or departments;
- Calculation of the daily mean over each zone;
- Calculation of coefficient of variability (CoV) over each zone;
- Calculation of anomalies over each zone;
- Production of variability maps (CoV) for the period 2005-2019;
- Production of anomaly maps of the last months in comparison to the 2005-2019 period.
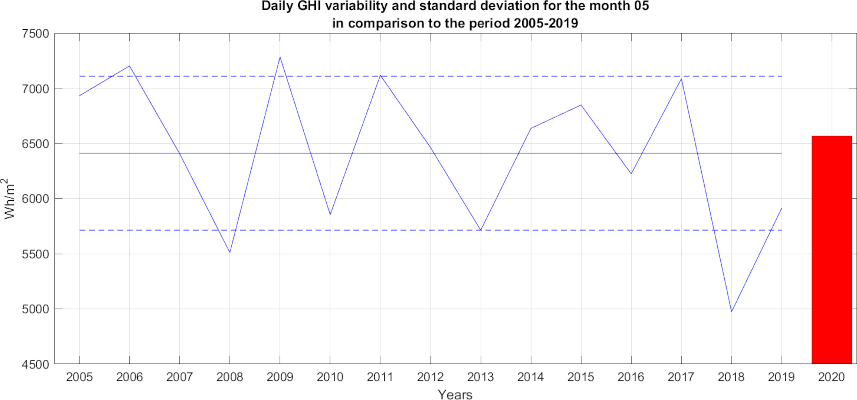
On this graph, for a specific location, you can observe:
- The blue curve represents the GHI daily mean for the month of May for each year for the period 2005-2019;
- The blue horizontal line is the GHI daily mean for the period 2005-2019;
- The dotted blue horizontal lines represent the standard deviations for the month of May;
- The red column shows the GHI daily mean value of May 2020.
Projects
In the future, we will provide an insight based on the climate projections to explore how climate projections could support investment and maintenance operations of investors, bankers, and during the whole lifetime of a photovoltaic project.
Do not hesitate to contact us to get anomaly maps over your site or region of interest.