
CAMS Rad - INMET
Validation CAMS Radiation - INMET stations |
Date of the validation: Jan. 2016 The HelioClim-3 radiation values are compared to the hourly Global Horizontal Irradiation measurements from the 31 stations of the INMET network. The measurements, also named observations, were originally quality checked using the procedure described here. As only the GHI component is available in the observations for both datasets, no consistency check is possible via cross-comparison from one component to another. Unfortunately, this protocol turned out to be insufficient for these hourly measurements and that the test to discard the not plausible values ("Extremely Rare Limits" and "Physical Possible Limits") were too permissive; Too many outlyers remained after the QC. Prior the computation of the different quantities to assess the deviation between the satellite estimates and the station measurements as depicted in the protocol of validation, we decided to discard also the measurement values when they are:
We remind that the other steps are:
Illustration: list of the stations used for the validation (INMET stations in yellow) => |
|
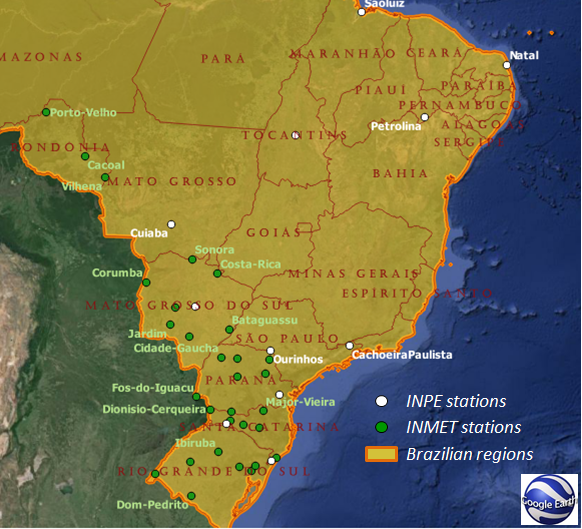
INMET stations used in this validation
Table 1:
| Station | State | Latitude (°) | Longitude (°) | Altitude (m) | Period of data availability |
| Agua-Clara | MS | -20.444 | -52.876 | 338 | 2010-08-16 to 2014-12-31 |
| Aquidauana | MS | -20.475 | -55.784 | 155 | 2006-11-01 to 2014-12-31 |
| Ararangua | SC | -28.931 | -49.498 | 12 | 2008-09-29 to 2014-12-31 |
| Bataguassu | MS | -21.750 | -52.471 | 387 | 2013-04-09 to 2014-12-31 |
| Cacoal | RO | -11.446 | -61.434 | 210 | 2008-07-20 to 2014-12-31 |
| Campo-Bom | RS | -29.674 | -51.064 | 24 | 2013-12-02 to 2014-12-31 |
| Canela | RS | -29.369 | -50.827 | 830 | 2008-08-27 to 2014-12-31 |
| Cidade-Gaucha | PR | -23.359 | -52.932 | 381 | 2008-03-11 to 2014-12-31 |
| Clevelandia | PR | -26.417 | -52.349 | 980 | 2008-05-16 to 2014-12-31 |
| Corumba | MS | -18.997 | -57.638 | 126 | 2006-10-26 to 2014-12-31 |
| Costa-Rica | MS | -18.493 | -53.171 | 730 | 2012-12-06 to 2014-12-31 |
| Curitibanos | SC | -27.289 | -50.604 | 982 | 2008-02-29 to 2014-12-31 |
| Dionisio-Cerqueira | SC | -26.287 | -53.633 | 810 | 2008-05-31 to 2014-12-31 |
| Dom-Pedrito | RS | -30.992 | -54.815 | 170 | 2010-04-27 to 2014-12-31 |
| Dourados | MS | -22.194 | -54.911 | 469 | 2006-10-21 to 2014-12-31 |
| Fos-do-Iguacu | PR | -25.602 | -54.483 | 321 | 2008-02-15 to 2014-12-31 |
| Ibiruba | RS | -28.653 | -53.112 | 456 | 2012-12-12 to 2014-12-31 |
| Jardim | MS | -21.479 | -56.138 | 249 | 2011-08-09 to 2014-12-31 |
| Joacaba | SC | -27.169 | -51.559 | 776 | 2007-10-16 to 2014-12-31 |
| Joaquim-Tavora | PR | -23.505 | -49.946 | 522 | 2006-11-24 to 2014-12-31 |
| Major-Vieira | SC | -26.394 | -50.363 | 808 | 2009-02-10 to 2014-12-31 |
| Maringa | PR | -23.405 | -51.933 | 542 | 2006-11-21 to 2014-12-31 |
| Nova-Tebas | PR | -24.437 | -51.963 | 654 | 2006-12-21 to 2014-12-31 |
| Porto-Velho | RO | -8.794 | -63.846 | 95 | 2007-07-12 to 2014-12-31 |
| Santiago | RS | -29.192 | -54.886 | 394 | 2009-02-04 to 2014-12-31 |
| Sonora | MS | -17.635 | -54.760 | 495 | 2012-12-03 to 2014-12-31 |
| Teutonia | RS | -29.450 | -51.824 | 81 | 2012-08-08 to 2014-12-31 |
| Uruguaiana | RS | -29.840 | -57.082 | 62 | 2006-09-28 to 2014-12-31 |
| Ventania | PR | -24.280 | -50.210 | 1106 | 2011-04-18 to 2014-12-31 |
| Vilhena | RO | -12.735 | -60.158 | 590 | 2008-08-26 to 2014-12-31 |
| Xanxere | SC | -26.939 | -52.398 | 889 | 2008-03-16 to 2014-12-31 |
GHI CAMS Radiation validation results - monthly, daily, and hourly sampling rates
(Click on the following link to show the corresponding statistics)
Monthly GHI
| CAMS radiation service -- GHI Quality assessment results vs. the INMET stations in Brazil MONTHLY SUM OF HOURLY IRRADIATION |
|||||
| Station | Number of values | Mean - INMET station - (kWh/m²) |
Bias (kWh/m2) (relative in %) |
RMSE (kWh/m2) (relative in %) |
Correl. coeff. |
| Agua-Clara | 35 | 152.8 | 12.6 (8.3%) | 13.5 (8.8%) | 0.986 |
| Aquidauana | 88 | 148.6 | 8.5 (5.7%) | 9.9 (6.7%) | 0.986 |
| Ararangua | 63 | 123.6 | 9.2 (7.5%) | 11.4 (9.2%) | 0.993 |
| Bataguassu | 14 | 153.5 | 7.9 (5.2%) | 8.7 (5.7%) | 0.996 |
| Cacoal | 70 | 130.5 | 15.9 (12.2%) | 17.8 (13.6%) | 0.921 |
| Campo-Bom | 6 | 149.5 | 14.7 (9.8%) | 15.2 (10.1%) | 0.999 |
| Canela | 69 | 130.2 | 8.9 (6.8%) | 11.3 (8.7%) | 0.995 |
| Cidade-Gaucha | 66 | 146.3 | 9.9 (6.8%) | 11.2 (7.6%) | 0.993 |
| Clevelandia | 73 | 138.2 | 11.1 (8.0%) | 13.5 (9.8%) | 0.992 |
| Corumba | 85 | 148.5 | 5.9 (4.0%) | 8.4 (5.7%) | 0.972 |
| Costa-Rica | 18 | 147.9 | 15.5 (10.5%) | 16.6 (11.2%) | 0.918 |
| Curitibanos | 76 | 131.4 | 5.1 (3.9%) | 6.8 (5.2%) | 0.996 |
| Dionisio-Cerqueira | 60 | 143.5 | 9.3 (6.5%) | 11.7 (8.2%) | 0.994 |
| Dom-Pedrito | 50 | 142.2 | 1.8 (1.3%) | 4.0 (2.8%) | 0.999 |
| Dourados | 86 | 148.8 | 9.1 (6.1%) | 11.2 (7.5%) | 0.987 |
| Fos-do-Iguacu | 69 | 139.3 | 2.0 (1.5%) | 5.5 (3.9%) | 0.994 |
| Ibiruba | 10 | 140.7 | 9.7 (6.9%) | 10.8 (7.7%) | 0.997 |
| Jardim | 33 | 153.3 | 10.0 (6.5%) | 11.3 (7.4%) | 0.991 |
| Joacaba | 79 | 139.2 | 10.3 (7.4%) | 12.3 (8.8%) | 0.995 |
| Joaquim-Tavora | 91 | 147.4 | 11.3 (7.7%) | 12.1 (8.2%) | 0.995 |
| Major-Vieira | 61 | 116.4 | 9.6 (8.3%) | 11.3 (9.7%) | 0.994 |
| Maringa | 67 | 152.9 | 3.1 (2.0%) | 7.9 (5.2%) | 0.980 |
| Nova-Tebas | 85 | 147.1 | 4.7 (3.2%) | 9.2 (6.2%) | 0.981 |
| Porto-Velho | 72 | 122.7 | 9.4 (7.7%) | 14.2 (11.6%) | 0.861 |
| Santiago | 61 | 144.1 | 2.5 (1.8%) | 5.4 (3.7%) | 0.996 |
| Sonora | 18 | 141.5 | 12.7 (9.0%) | 14.1 (10.0%) | 0.944 |
| Teutonia | 5 | 139.5 | 14.3 (10.3%) | 14.9 (10.7%) | 1.000 |
| Uruguaiana | 86 | 148.4 | -1.3 (-0.9%) | 3.3 (2.3%) | 0.998 |
| Ventania | 23 | 148.6 | 16.9 (11.4%) | 18.7 (12.6%) | 0.984 |
| Vilhena | 69 | 127.7 | 16.4 (12.9%) | 17.8 (13.9%) | 0.955 |
| Xanxere | 68 | 142.1 | 6.7 (4.7%) | 9.3 (6.6%) | 0.993 |
Daily GHI
| CAMS radiation service -- GHI Quality assessment results vs. the INMET stations in Brazil DAILY SUM OF HOURLY IRRADIATION |
|||||
| Station | Number of values | Mean - INMET station - (Wh/m²) |
Bias (Wh/m2) (relative in %) |
RMSE (Wh/m2) (relative in %) |
Correl. coeff. |
| Agua-Clara | 1035 | 5345.0 | 423.2 (7.9%) | 656.9 (12.3%) | 0.951 |
| Aquidauana | 2476 | 5304.3 | 303.1 (5.7%) | 607.3 (11.4%) | 0.948 |
| Ararangua | 1752 | 4449.6 | 332.4 (7.5%) | 652.4 (14.7%) | 0.966 |
| Bataguassu | 393 | 5453.6 | 281.9 (5.2%) | 487.3 (8.9%) | 0.973 |
| Cacoal | 1888 | 4807.7 | 588.9 (12.2%) | 894.8 (18.6%) | 0.804 |
| Campo-Bom | 164 | 5460.3 | 534.5 (9.8%) | 694.9 (12.7%) | 0.982 |
| Canela | 1828 | 4950.4 | 335.5 (6.8%) | 694.2 (14.0%) | 0.960 |
| Cidade-Gaucha | 1902 | 5127.5 | 348.9 (6.8%) | 574.0 (11.2%) | 0.972 |
| Clevelandia | 1991 | 5056.9 | 405.9 (8.0%) | 707.5 (14.0%) | 0.959 |
| Corumba | 2356 | 5350.4 | 214.6 (4.0%) | 649.9 (12.1%) | 0.913 |
| Costa-Rica | 500 | 5305.8 | 555.4 (10.5%) | 799.0 (15.1%) | 0.898 |
| Curitibanos | 2118 | 4714.4 | 182.5 (3.9%) | 615.6 (13.1%) | 0.953 |
| Dionisio-Cerqueira | 1740 | 5110.2 | 329.9 (6.5%) | 603.9 (11.8%) | 0.971 |
| Dom-Pedrito | 1373 | 5146.0 | 68.7 (1.3%) | 383.2 (7.4%) | 0.987 |
| Dourados | 2473 | 5202.8 | 322.8 (6.2%) | 622.2 (12.0%) | 0.958 |
| Fos-do-Iguacu | 1945 | 5038.6 | 73.6 (1.5%) | 568.3 (11.3%) | 0.965 |
| Ibiruba | 307 | 5770.6 | 381.0 (6.6%) | 784.7 (13.6%) | 0.953 |
| Jardim | 938 | 5430.4 | 351.4 (6.5%) | 612.2 (11.3%) | 0.959 |
| Joacaba | 2253 | 4877.0 | 359.6 (7.4%) | 674.7 (13.8%) | 0.965 |
| Joaquim-Tavora | 2658 | 5040.5 | 385.6 (7.7%) | 632.0 (12.5%) | 0.962 |
| Major-Vieira | 1606 | 4448.6 | 367.9 (8.3%) | 611.3 (13.7%) | 0.965 |
| Maringa | 1943 | 5267.6 | 105.5 (2.0%) | 580.4 (11.0%) | 0.952 |
| Nova-Tebas | 2420 | 5238.9 | 164.8 (3.1%) | 588.7 (11.2%) | 0.956 |
| Porto-Velho | 1896 | 4642.4 | 358.0 (7.7%) | 861.5 (18.6%) | 0.746 |
| Santiago | 1730 | 5128.8 | 91.2 (1.8%) | 465.0 (9.1%) | 0.980 |
| Sonora | 475 | 5355.4 | 479.2 (8.9%) | 791.0 (14.8%) | 0.882 |
| Teutonia | 272 | 4958.8 | 625.1 (12.6%) | 958.7 (19.3%) | 0.942 |
| Uruguaiana | 2430 | 5277.0 | -46.8 (-0.9%) | 483.5 (9.2%) | 0.979 |
| Ventania | 661 | 5180.7 | 589.9 (11.4%) | 772.5 (14.9%) | 0.961 |
| Vilhena | 1852 | 4754.5 | 612.6 (12.9%) | 906.8 (19.1%) | 0.820 |
| Xanxere | 1926 | 5069.8 | 243.3 (4.8%) | 649.0 (12.8%) | 0.959 |
Hourly GHI
| CAMS radiation service -- GHI Quality assessment results vs. the INMET stations in Brazil HOURLY SUM OF HOURLY IRRADIATION |
|||||
| Station | Number of values | Mean - INMET station - (Wh/m²) |
Bias (Wh/m2) (relative in %) |
RMSE (Wh/m2) (relative in %) |
Correl. coeff. |
| Agua-Clara | 12305 | 463.9 | 37.0 (8.0%) | 109.6 (23.6%) | 0.945 |
| Aquidauana | 28434 | 463.5 | 26.4 (5.7%) | 96.9 (20.9%) | 0.952 |
| Ararangua | 20607 | 381.7 | 29.0 (7.6%) | 98.9 (25.9%) | 0.949 |
| Bataguassu | 4562 | 471.2 | 24.4 (5.2%) | 82.4 (17.5%) | 0.967 |
| Cacoal | 22106 | 415.8 | 50.7 (12.2%) | 141.3 (34.0%) | 0.892 |
| Campo-Bom | 2037 | 440.5 | 43.2 (9.8%) | 100.4 (22.8%) | 0.962 |
| Canela | 21314 | 425.1 | 28.8 (6.8%) | 107.6 (25.3%) | 0.942 |
| Cidade-Gaucha | 21972 | 444.3 | 30.3 (6.8%) | 90.1 (20.3%) | 0.961 |
| Clevelandia | 23248 | 434.1 | 34.9 (8.0%) | 105.7 (24.3%) | 0.946 |
| Corumba | 27045 | 473.9 | 19.1 (4.0%) | 106.0 (22.4%) | 0.939 |
| Costa-Rica | 5712 | 466.1 | 48.7 (10.5%) | 126.0 (27.0%) | 0.926 |
| Curitibanos | 24616 | 405.7 | 15.7 (3.9%) | 106.1 (26.1%) | 0.935 |
| Dionisio-Cerqueira | 20124 | 442.6 | 28.6 (6.5%) | 102.3 (23.1%) | 0.948 |
| Dom-Pedrito | 15765 | 451.0 | 5.8 (1.3%) | 70.2 (15.6%) | 0.975 |
| Dourados | 28524 | 452.6 | 27.7 (6.1%) | 104.5 (23.1%) | 0.945 |
| Fos-do-Iguacu | 22009 | 452.4 | 6.6 (1.5%) | 94.0 (20.8%) | 0.954 |
| Ibiruba | 3653 | 493.0 | 32.6 (6.6%) | 121.5 (24.6%) | 0.934 |
| Jardim | 10837 | 470.2 | 30.5 (6.5%) | 98.2 (20.9%) | 0.954 |
| Joacaba | 26362 | 417.3 | 30.8 (7.4%) | 100.6 (24.1%) | 0.951 |
| Joaquim-Tavora | 31140 | 430.7 | 33.0 (7.7%) | 96.5 (22.4%) | 0.957 |
| Major-Vieira | 18658 | 383.5 | 31.7 (8.3%) | 97.5 (25.4%) | 0.951 |
| Maringa | 22577 | 453.7 | 9.1 (2.0%) | 106.5 (23.5%) | 0.938 |
| Nova-Tebas | 27930 | 454.6 | 14.4 (3.2%) | 102.2 (22.5%) | 0.945 |
| Porto-Velho | 21725 | 415.4 | 30.9 (7.5%) | 147.5 (35.5%) | 0.860 |
| Santiago | 19827 | 449.4 | 7.9 (1.8%) | 82.5 (18.3%) | 0.965 |
| Sonora | 5430 | 469.2 | 42.2 (9.0%) | 129.5 (27.6%) | 0.916 |
| Teutonia | 3177 | 433.7 | 54.1 (12.5%) | 144.5 (33.3%) | 0.904 |
| Uruguaiana | 27839 | 462.5 | -4.0 (-0.9%) | 81.0 (17.5%) | 0.967 |
| Ventania | 7803 | 438.9 | 50.0 (11.4%) | 109.8 (25.0%) | 0.950 |
| Vilhena | 21838 | 404.8 | 52.1 (12.9%) | 143.6 (35.5%) | 0.890 |
| Xanxere | 22384 | 438.0 | 21.5 (4.9%) | 106.3 (24.3%) | 0.941 |