TMY
Typical Meteorological YearTo assess solar and meteorological data over a specific location for a one year periodPresentation - Demonstration - Service Principle - Methodology |
|
A Typical Meteorological Year is one synthetic year of solar and meteorological parameter(s) at a hourly time step, which is representative of a weather scenario over your location:
• median e.g. Percentile 50
• pessimistic e.g. Percentile 90
A TMY is created using numerous years of time series.
The TMY is based on the following databases and provides:
• HelioClim-3 version 5 for the Global and Diffuse Horizontal, Direct Normal, and Global Tilted solar data;
• MERRA reanalysis from NASA for the weather variables: temperature, pressure, relative humidity, and wind speed.
⇒ A calibration of the solar data can be applied using your ground measurements to improve the quality of the TMY.
⇒ The TMY are delivered on demand.
|
WHY USING TMY?
|
|
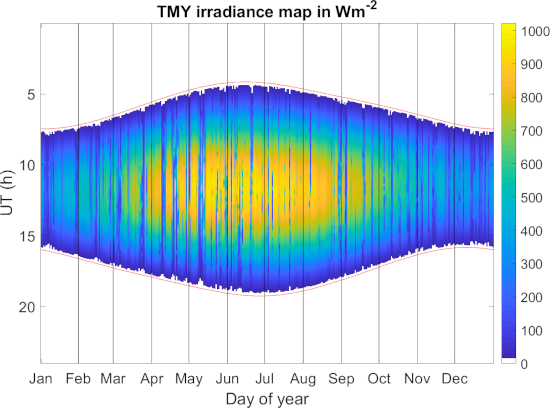
One Typical Meteorological Year over Carpentras, France (44.0830, 5.0590) created using 1 min Global Horizontal Irradiation from HelioClim-3 |
This TMY has been made with these parameters:
Long-term time series:
Databases used:
Output formats:
|
► Sample TMY over Carpentras : download full dataset
|
HelioClim-3 solar radiation GTI time series used to build the TMY |
TMY report |
Report of uncertainty: positioning of the TMY compared to the long term HC3 time series |
TMY P50 data CSV compatible with the PVsyst software |
TMY P90 data CSV compatible with the PVsyst software |
TMY P50 data CSV compatible with the System Advisor Model (SAM, NREL) |
TMY P90 data CSV compatible with the System Advisor Model (SAM, NREL) |
service principle
The SoDa TMY methodology is based on the following:
⇒ For the Median TMY (P50), we are computing a FS50 TMY with the minimum Finkelstein-Schafer distance for each month versus the average monthly cumulated distribution of the month. The difference with the standard Sandia approach (linear weighted combination of different variables) is to use a "driver" representative of the solar technology of interest for the project, for instance:
- For a fixed tilted PV system, we will use the hourly Global Tilted Irradiation
- For a 1 axis PV system, we will use the hourly computed in plane irradiation (with tilt angle limit and a simple standard backtracking scheme)
- For a CPV system, we will use the DNI, excluding the hours when the wind exceeds a maximum speed (depends on the tracking system limits)
- For a CSP system, we will use the DNI corrected with the cosine of incidence angle effect and the limits of the range for tilt
- Any other parameter could be considered, like temperature, if its incidence on the system yield can be expressed with an equation.
⇒ The "Pessimistic" TMY (P90) is computed with the percentile method, also for the "driver" value. With the 15 full years of data available from HelioClim3-v5, the standard deviation of the long-term annual values of the driver irradiation is computed and multiplied by 1.28155 to obtain a P90 estimate. Then, the P90 representative year is chosen as the year for which the annual sum of the driver irradiation is the closest to the P90 estimation. As the number of years is not large, the P90 year is nearly at all times either the worst year or the second worst year in the long-term time series. Numerous other variants exist to compute a P90, but it is very difficult to determine which one is the best due to the relatively short number of years available for a given site compared to what would be really necessary to do a statistical P90 approach.
⇒ In our "Long term irradiation data analysis report", which is a standard companion report to our TMY analysis, we do an annual P90 statistical approach, including also the P90 evolution when looking at the expectations for multiple consecutive years.
methodology
⇒ The TMY generation service methodology report describes:
- FS50 (P50) TMY creation methodology
- P50 TMY validation results of the "driver" approach
- P90 TMY creation methodology
Please specify:
- The latitude and longitude of your location
- The plane orientation
- The output format (PVsyst or TMY3 or SAM)
- The percentile (P50, P75, P90)
- The solar technology for which the TMY will be used for (to define our "driver")
- Precise as well if you wish to receive the long term HelioClim-3 time series for this location


