Radiation trends
Comparison of different periods of time for Radiation |
Here is an example of use of the European Climatic Energy Mixes (ECEM) demonstrator. This demonstrator is a tool which aims at enabling the energy industry and policy makers to assess how well energy supply will meet demand in Europe over different time horizons, focusing on the role climate has on energy supply and demand. We invite you to explore this tool.
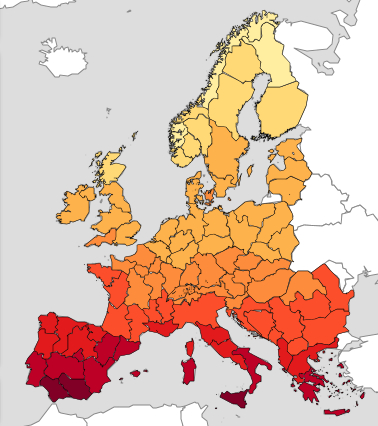
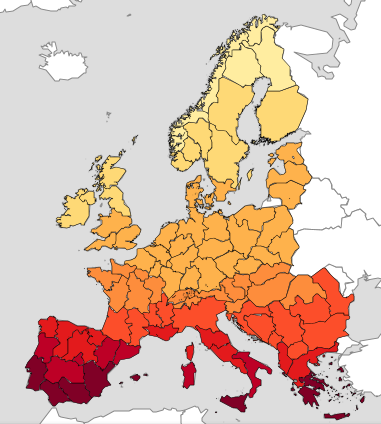
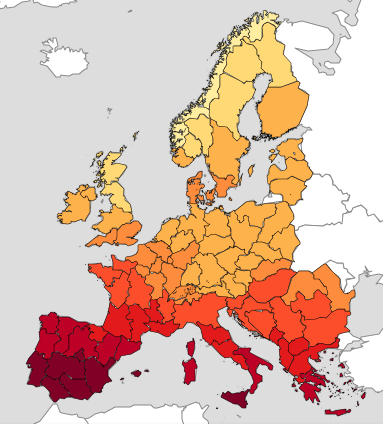
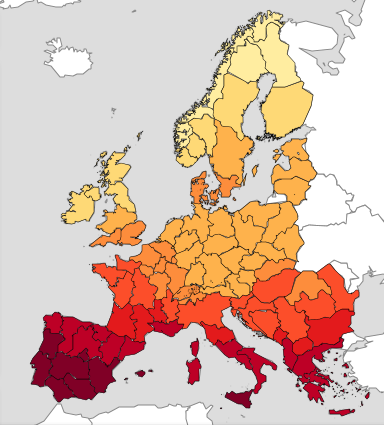
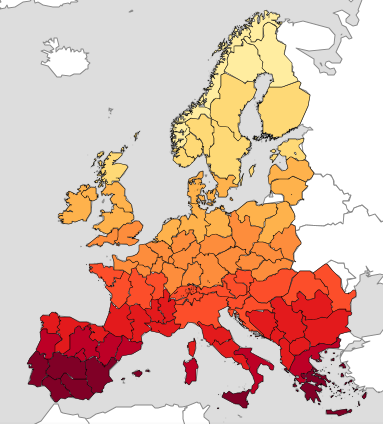
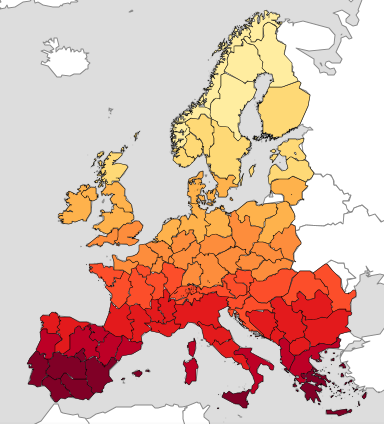
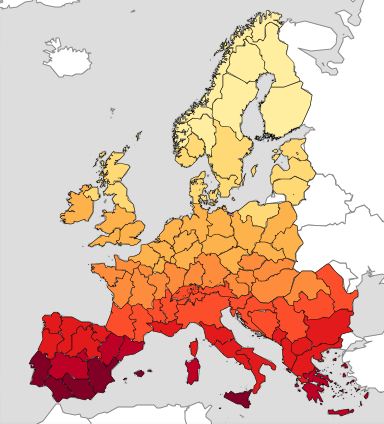
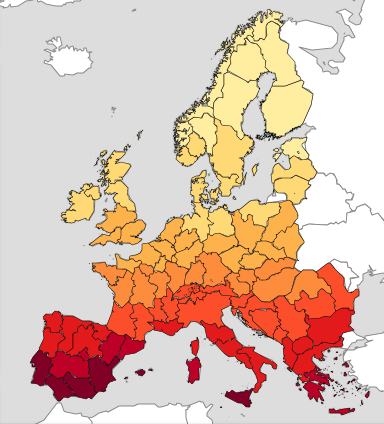
The maps below depict the seasonal climatic projections for the long term radiation (Global Horizontal Irradiation) average in the past projections (1981-2010) compared to the future ones (2035-2064).
ECEM demonstrator input assumptions (more information on climate acronyms):
- Cluster representation
- Time Period: Climate Projections
- Variables: Climate
- Temporal Resolution: 3 months
- Season: Spring, Summer, Autumn, or Winter
- Statistics: Long term mean(s)
- Climate Model: Ensemble Mean
- Emission Scenario: RCP8.5
Take also a look to the Key Message "Solar radiation changes" available on the ECEM demonstrator.
| 1981-2010 | 2035-2064 | |
|---|---|---|
|
SPRING (MAM for March, April, May) |
|
|
|
SUMMER (JJA for June, July, August) |
|
|
|
AUTUMN (SON for September, October, November) |
|
|
|
WINTER (DJF for December, January, February) |
|
|

