
Linke turbidity factor
Linke turbidity (Tl) factor worldwide |
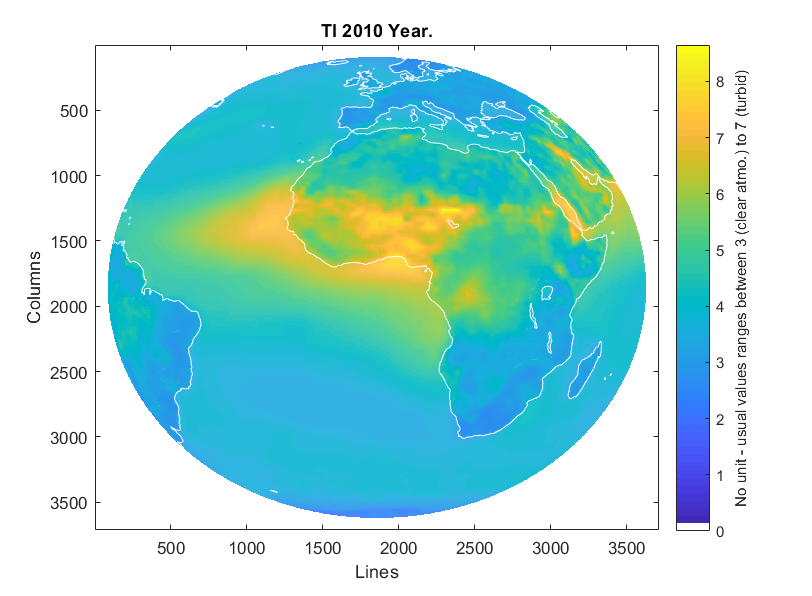
2010 TL maps and webservice
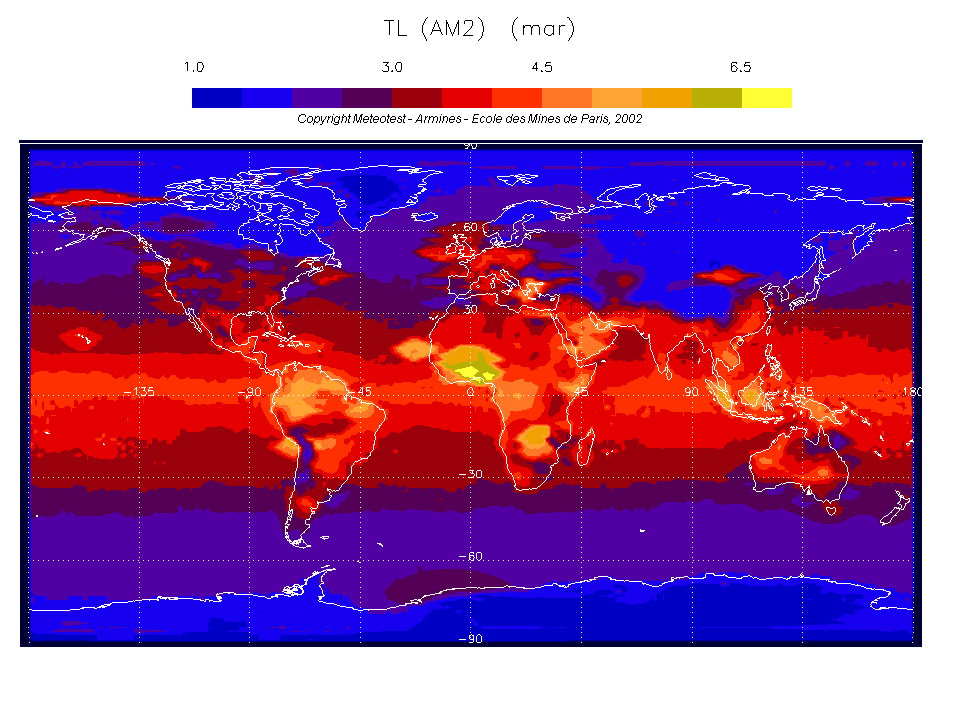
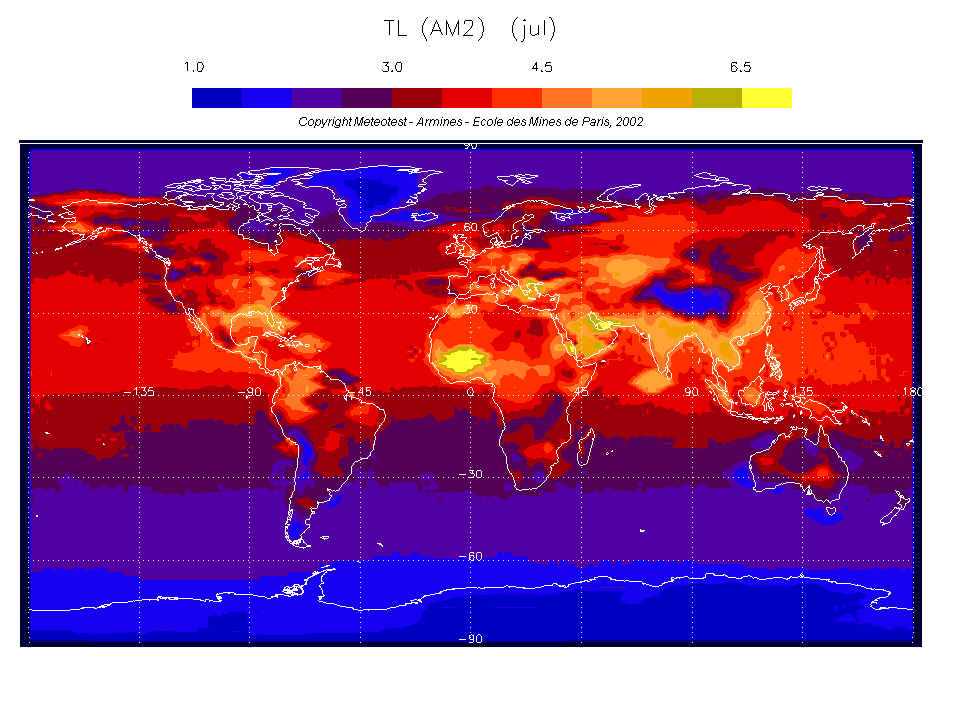
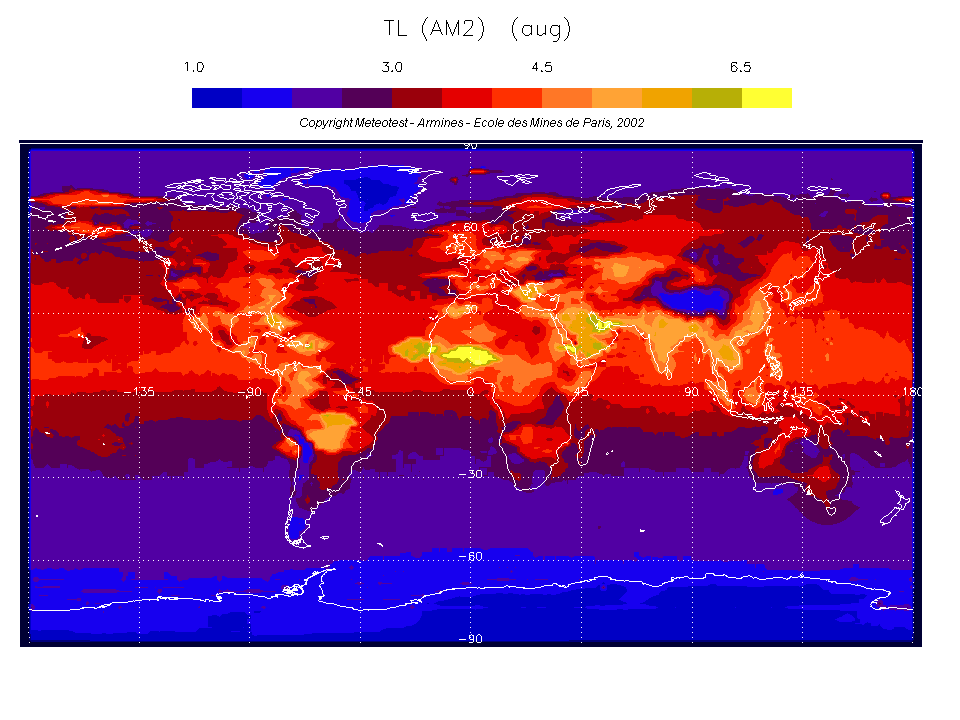
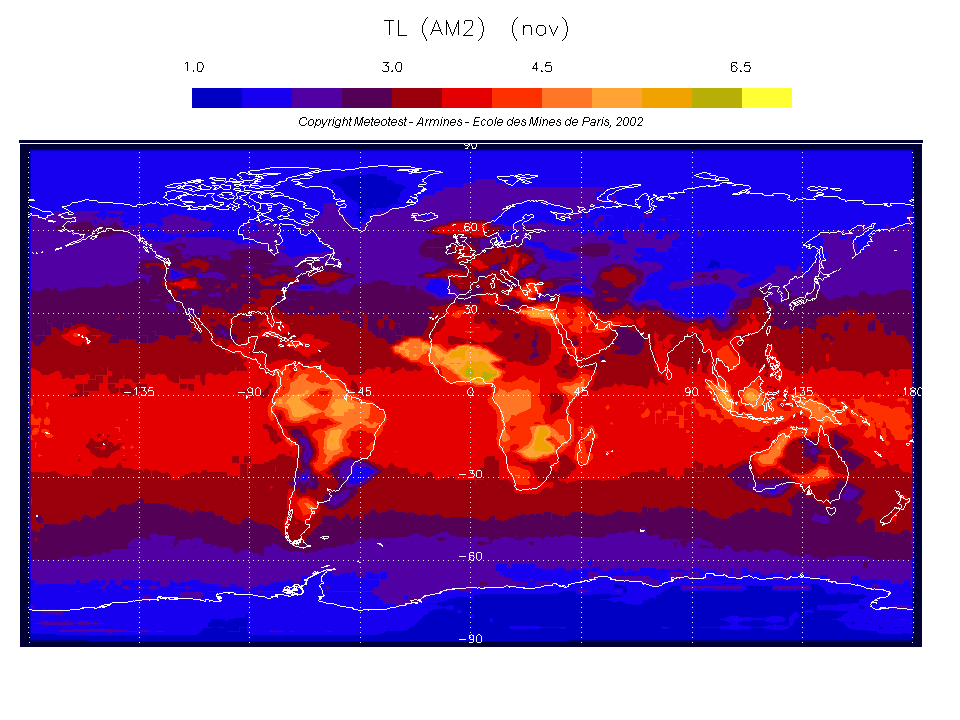
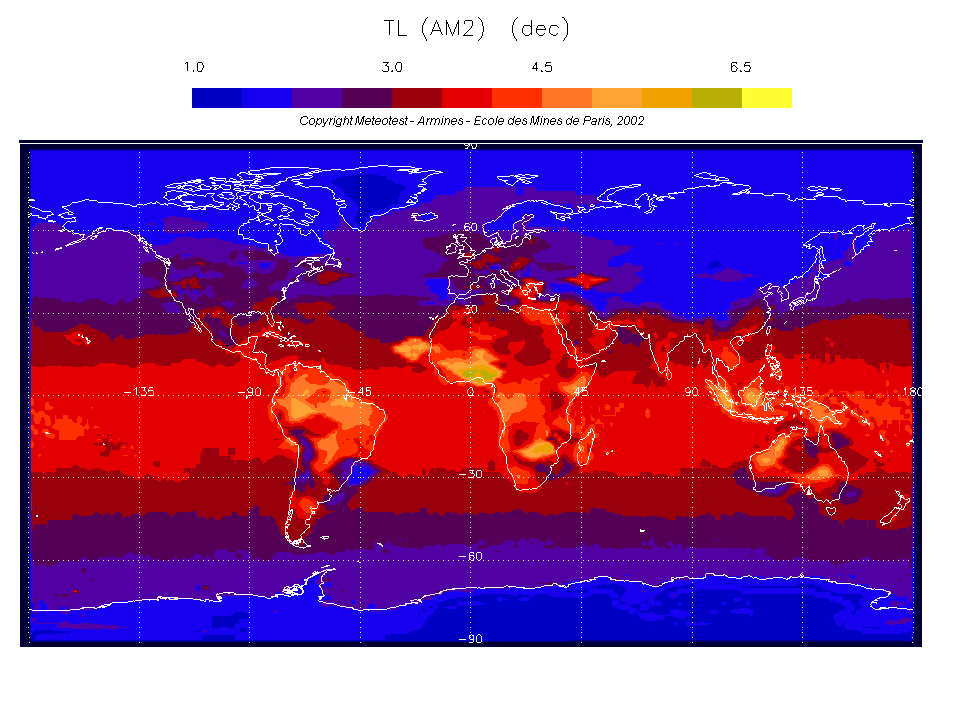
| MAPS | The Linke turbidity factor (TL, for an air mass equal to 2) is a very convenient approximation to model the atmospheric absorption and scattering of the solar radiation under clear skies. It describes the optical thickness of the atmosphere due to both the absorption by the water vapor and the absorption and scattering by the aerosol particles relative to a dry and clean atmosphere. It summarizes the turbidity of the atmosphere, and hence the attenuation of the direct beam solar radiation. The larger TL, the larger the attenuation of the radiation by the clear sky atmosphere. The TL denotes the transparency of the cloudless atmosphere. If the sky were perfectly dry and clean, TL would be equal to 1. When the sky is deep blue, the TL is just above 1 and still very small. In summer, in Europe, the water vapour is often large and the blue sky is close to white. The TL is larger than 3. In turbid atmosphere, e.g. in polluted cities, the TL is close to 6 - 7. Grid description:
Downloads:
REFERENCE: IEA_report_2010.pdf |
(Click on the images to magnify) |
|---|

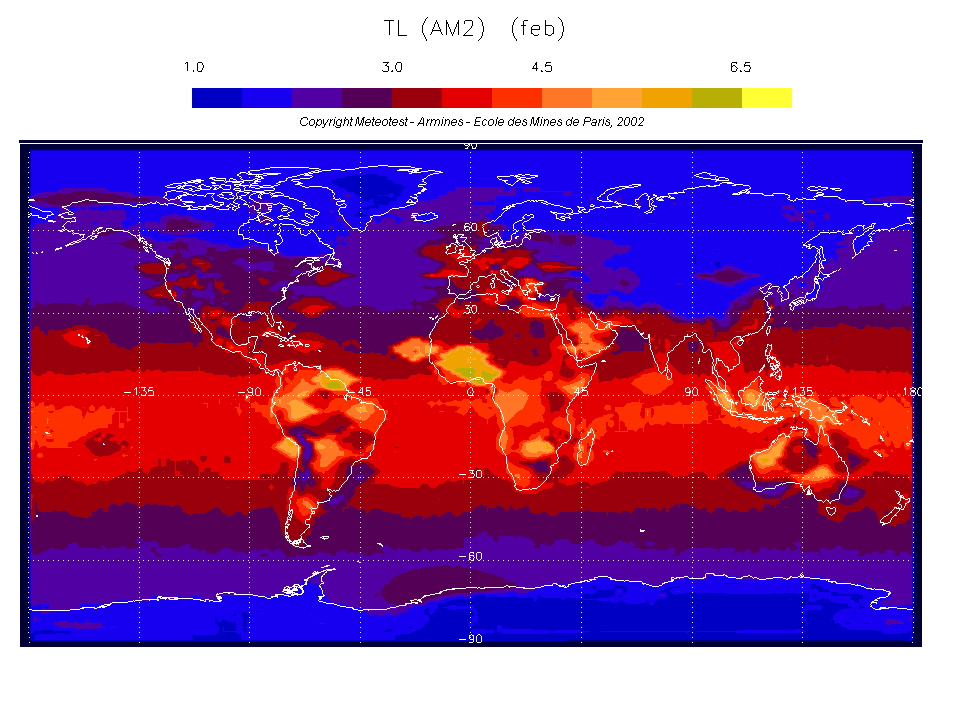
2003 TL maps
| Methodology | Within the project SoDa More in details, the Linke turbidity is based on several global information from satellites like global clear sky radiation (SRB gridded data from NASA), precipitable water vapour (NVAP), aerosol optical depth (pathfinder) and ground information about turbidity from radiation or aerosol measurements (AERONET). Turbidity has been calculated with beam or global radiation measurements at the ground with help of the ESRA (European Solar Radiation Atlas) clear sky radiation model. Satellite and ground information have been fitted together. In order to cope with the large differences in spatial resolution, fusion methods have been applied on these date together with water vapour maps and orography information. Errors were assessed by cross-checking (LOOV-Leave One Out Validation) which consists in removing one station (out of approx. 220), making calculation for this site (using the elevation database and not the actual elevation) and computing the discrepancy. The bias was found to be 0.01 and the RMSE 0.73 as an annual average with slight deviations from month to month. Publications, with - keyword "Linke Turbidity factor": WMO 1981; Kasten 1996, Remund et al. 2003, Diabaté et al. 2003, Rigollier et al. 2000, see also Holben et al. 2001. | |
|---|---|---|
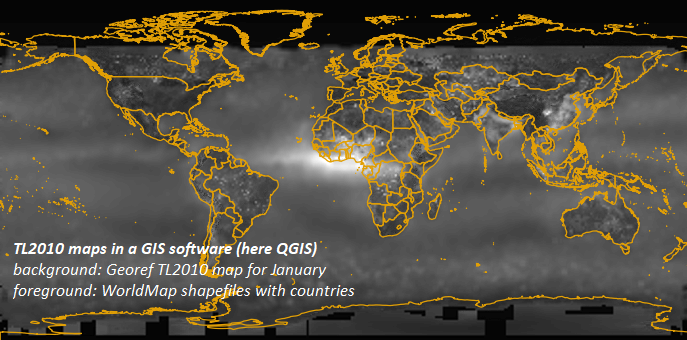
Tl 2003 maps | Twelve monthly maps of Linke turbidity factor values were created given by latitude and longitude. Latitude is positive North, longitude is positive eastwards of longitude 0. The data are in gridded, raw format, no header (tiff images), 1 byte per value (unsigned int encoding), 2160 rows and 4320 columns. Cell size is 5' (approx. 10 km at mid-latitude). Upper left corner is 90 N, 180 W. Then, point 90 N, 179.5 W etc. Lower right is 90S, 180 E. Download images in png format: January, February, March, April, May, June, July, August, September, October, November, December. Download images in tiff format (zip compressed) by trimesters: 1st trimester, 2nd, 3rd, 4th |  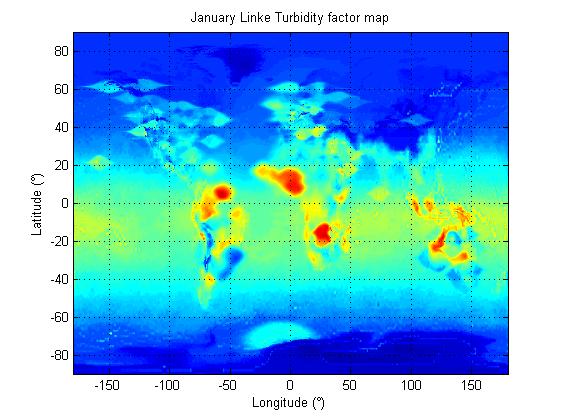 Two representations for January Tl values. (Click on images to magnify) |