
EnerMENA - previous CAMS Radiation Service validation
Validation CAMS Radiation Service - EnerMENA stations |
Date of the validation: May 2019 Illustration: list of the EnerMENA stations used for the validation => |
|
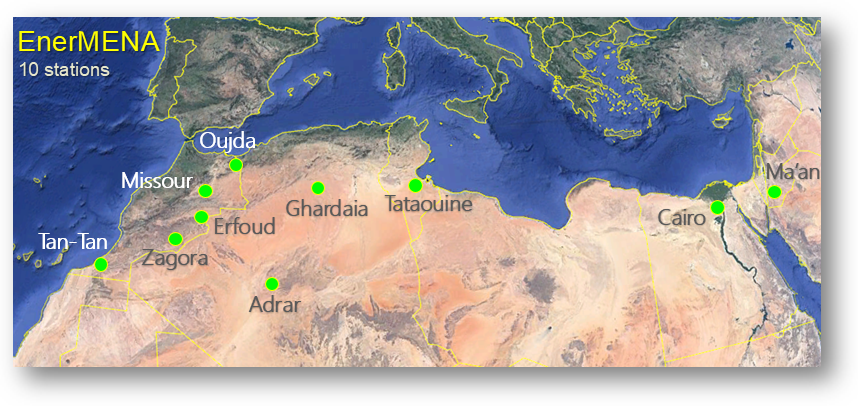
EnerMENA stations used in this validation
Table 1: in decreasing latitudes. "TS" stands for Thermal Sensors and "RSI" for Rotating Shadowband Irradiometer sensors.
| Station | Country | Station Type | Latitude (°) | Longitude (°) | Altitude (m) | Period | Climate |
| Oujda | Morocco | TS | 34.650 | -1.900 | 617 | 2015-01-06 to 2018-10-02 | Mediterranean |
| Tataouine | Tunisia | TS | 32.974 | 10.485 | 210 | 2014-12-31 to 2017-09-15 | Desertic |
| Missour | Morocco | TS | 32.860 | -4.107 | 1107 | 2015-01-01 to 2018-09-20 | Desertic - Montaneous |
| Ghardaia | Algeria | TS | 32.386 | 3.780 | 463 | 2014-12-31 to 2016-04-01 | Desertic |
| Erfoud | Morocco | RSI | 31.491 | -4.218 | 859 | 2015-01-24 to 2018-10-02 | Desertic |
| Zagora | Morocco | RSI | 30.272 | -5.852 | 783 | 2015-01-01 to 2018-10-01 | Desertic |
| Ma'an | Jordan | TS | 30.172 | 35.818 | 1012 | 2014-12-31 to 2018-01-22 | Desertic |
| Cairo | Egypt | TS | 30.036 | 31.009 | 104 | 2014-12-31 to 2018-09-14 | Desertic - Mediterranean |
| Tan-Tan | Morocco | TS | 28.498 | -11.322 | 75 | 2015-01-01 to 2016-12-02 | Desertic - Oceanic |
| Adrar | Algeria | TS | 27.878 | -0.270 | 262 | 2014-12-31 to 2018-03-29 | Desertic |
Interpretation of results
Most sites are located in desertic areas, in which an underestimation of the radiation is observed. The exception is the site of Tan-Tan, located close to the sea shore.
GHI and DNI CAMS Radiation validation results - monthly, daily, hourly and 15 min sampling rates
(Click on the following link to show the corresponding statistics)
Monthly GHI
| CAMS-Radiation -- GHI Quality assessment results vs. the stations MONTHLY IRRADIATION |
||||||
| Station | Number of values | Mean station (kWh/m2) |
Bias (kWh/m2) (relative in %) |
STDEV (kWh/m2) (relative in %) |
RMSE (kWh/m2) (relative in %) |
Correl. coeff. |
| Tataouine | 31 | 168.58 | -11.01 (-6.53%) | 5.19 (3.08%) | 12.17 (7.22%) | 0.996 |
| Ma'an | 30 | 181.51 | -8.86 (-4.88%) | 3.00 (1.65%) | 9.35 (5.15%) | 0.999 |
| Oujda | 44 | 157.01 | -3.32 (-2.12%) | 5.40 (3.44%) | 6.34 (4.04%) | 0.996 |
| Cairo | 44 | 162.03 | -4.37 (-2.70%) | 5.30 (3.27%) | 6.87 (4.24%) | 0.995 |
| Adrar | 24 | 182.23 | -17.69 (-9.71%) | 7.73 (4.24%) | 19.30 (10.59%) | 0.989 |
| Ghardaia | 15 | 156.03 | -15.78 (-10.11%) | 7.95 (5.09%) | 17.66 (11.32%) | 0.991 |
| Missour | 33 | 150.51 | -11.54 (-7.66%) | 4.17 (2.77%) | 12.27 (8.15%) | 0.998 |
| Erfoud | 44 | 168.33 | -4.73 (-2.81%) | 4.82 (2.86%) | 6.75 (4.01%) | 0.996 |
| Zagora | 44 | 182.99 | -9.99 (-5.46%) | 6.76 (3.69%) | 12.06 (6.59%) | 0.989 |
| Tan-Tan | 16 | 137.43 | 1.52 (1.10%) | 7.44 (5.42%) | 7.60 (5.53%) | 0.974 |
Daily GHI
| CAMS-Radiation -- GHI Quality assessment results vs. the stations DAILY IRRADIATION |
||||||
| Station | Number of values | Mean station (Wh/m2) |
Bias (Wh/m2) (relative in %) |
STDEV (Wh/m2) (relative in %) |
RMSE (Wh/m2) (relative in %) |
Correl. coeff. |
| Tataouine | 906 | 5729.94 | -371.21 (-6.48%) | 437.11 (7.63%) | 573.46 (10.01%) | 0.977 |
| Ma'an | 886 | 6287.53 | -308.08 (-4.90%) | 302.13 (4.81%) | 431.50 (6.86%) | 0.988 |
| Oujda | 1294 | 5312.51 | -111.74 (-2.10%) | 427.74 (8.05%) | 442.09 (8.32%) | 0.981 |
| Cairo | 1245 | 5755.98 | -151.89 (-2.64%) | 390.03 (6.78%) | 418.57 (7.27%) | 0.979 |
| Adrar | 725 | 6169.53 | -590.06 (-9.56%) | 500.96 (8.12%) | 774.03 (12.55%) | 0.953 |
| Ghardaia | 410 | 5653.91 | -572.80 (-10.13%) | 492.50 (8.71%) | 755.42 (13.36%) | 0.964 |
| Missour | 938 | 5523.54 | -422.32 (-7.65%) | 458.96 (8.31%) | 623.70 (11.29%) | 0.973 |
| Erfoud | 1266 | 5836.64 | -162.18 (-2.78%) | 377.40 (6.47%) | 410.77 (7.04%) | 0.973 |
| Zagora | 1295 | 6220.66 | -338.06 (-5.43%) | 432.84 (6.96%) | 549.21 (8.83%) | 0.966 |
| Tan-Tan | 477 | 5050.15 | 102.69 (2.03%) | 736.16 (14.58%) | 743.29 (14.72%) | 0.894 |
Hourly GHI
| CAMS-Radiation -- GHI Quality assessment results vs. the stations HOURLY IRRADIATION |
||||||
| Station | Number of values | Mean station (Wh/m2) |
Bias (Wh/m2) (relative in %) |
STDEV (Wh/m2) (relative in %) |
RMSE (Wh/m2) (relative in %) |
Correl. coeff. |
| Tataouine | 11372 | 459.94 | -29.94 (-6.51%) | 61.22 (13.31%) | 68.15 (14.82%) | 0.980 |
| Ma'an | 11207 | 502.38 | -24.79 (-4.93%) | 45.55 (9.07%) | 51.86 (10.32%) | 0.990 |
| Oujda | 15765 | 438.48 | -9.47 (-2.16%) | 64.90 (14.80%) | 65.59 (14.96%) | 0.977 |
| Cairo | 14647 | 487.84 | -12.77 (-2.62%) | 53.26 (10.92%) | 54.77 (11.23%) | 0.985 |
| Adrar | 8986 | 497.73 | -47.60 (-9.56%) | 59.93 (12.04%) | 76.54 (15.38%) | 0.983 |
| Ghardaia | 4941 | 471.00 | -47.64 (-10.12%) | 62.97 (13.37%) | 78.96 (16.76%) | 0.979 |
| Missour | 11349 | 462.26 | -35.48 (-7.67%) | 79.52 (17.20%) | 87.08 (18.84%) | 0.968 |
| Erfoud | 15126 | 487.66 | -13.62 (-2.79%) | 58.71 (12.04%) | 60.27 (12.36%) | 0.981 |
| Zagora | 16410 | 492.77 | -26.89 (-5.46%) | 59.88 (12.15%) | 65.64 (13.32%) | 0.982 |
| Tan-Tan | 5815 | 425.26 | 8.87 (2.08%) | 88.50 (20.81%) | 88.94 (20.91%) | 0.954 |
15 min GHI
| CAMS-Radiation -- GHI Quality assessment results vs. the stations 15 MIN IRRADIATION |
||||||
| Station | Number of values | Mean station (Wh/m2) |
Bias (Wh/m2) (relative in %) |
STDEV (Wh/m2) (relative in %) |
RMSE (Wh/m2) (relative in %) |
Correl. coeff. |
| Tataouine | 43044 | 121.74 | -7.93 (-6.51%) | 19.00 (15.61%) | 20.59 (16.91%) | 0.968 |
| Ma'an | 42289 | 133.62 | -6.60 (-4.94%) | 14.53 (10.87%) | 15.96 (11.94%) | 0.983 |
| Oujda | 60704 | 114.16 | -2.42 (-2.12%) | 20.96 (18.36%) | 21.10 (18.49%) | 0.961 |
| Cairo | 56939 | 126.68 | -3.34 (-2.64%) | 17.07 (13.48%) | 17.39 (13.73%) | 0.975 |
| Adrar | 34175 | 131.42 | -12.58 (-9.57%) | 17.48 (13.30%) | 21.54 (16.39%) | 0.974 |
| Ghardaia | 18907 | 123.78 | -12.52 (-10.11%) | 18.55 (14.99%) | 22.38 (18.08%) | 0.969 |
| Missour | 43427 | 121.58 | -9.32 (-7.67%) | 24.98 (20.54%) | 26.66 (21.93%) | 0.949 |
| Erfoud | 58195 | 127.27 | -3.57 (-2.81%) | 19.16 (15.05%) | 19.49 (15.31%) | 0.966 |
| Zagora | 61751 | 131.14 | -7.15 (-5.46%) | 19.55 (14.91%) | 20.82 (15.88%) | 0.968 |
| Tan-Tan | 22437 | 110.79 | 2.36 (2.13%) | 25.52 (23.03%) | 25.62 (23.13%) | 0.939 |
Monthly DNI
| CAMS-Radiation -- DNI Quality assessment results vs. the stations MONTHLY IRRADIATION |
||||||
| Station | Number of values | Mean station (kWh/m2) |
Bias (kWh/m2) (relative in %) |
STDEV (kWh/m2) (relative in %) |
RMSE (kWh/m2) (relative in %) |
Correl. coeff. |
| Tataouine | 31 | 179.29 | -23.65 (-13.19%) | 19.08 (10.64%) | 30.39 (16.95%) | 0.921 |
| Ma'an | 30 | 216.77 | -24.06 (-11.10%) | 10.34 (4.77%) | 26.19 (12.08%) | 0.980 |
| Oujda | 44 | 170.84 | -7.09 (-4.15%) | 8.23 (4.82%) | 10.86 (6.36%) | 0.974 |
| Cairo | 43 | 158.01 | 5.15 (3.26%) | 14.28 (9.04%) | 15.18 (9.61%) | 0.954 |
| Adrar | 21 | 180.19 | -27.48 (-15.25%) | 16.73 (9.28%) | 32.17 (17.86%) | 0.855 |
| Ghardaia | 15 | 177.40 | -35.52 (-20.02%) | 16.51 (9.30%) | 39.17 (22.08%) | 0.927 |
| Missour | 31 | 175.14 | -23.92 (-13.66%) | 15.00 (8.57%) | 28.24 (16.12%) | 0.900 |
| Erfoud | 33 | 195.66 | -11.32 (-5.78%) | 14.51 (7.41%) | 18.40 (9.40%) | 0.901 |
| Zagora | 44 | 204.45 | -18.06 (-8.83%) | 18.45 (9.02%) | 25.82 (12.63%) | 0.913 |
| Tan-Tan | 11 | 134.95 | 7.25 (5.37%) | 14.50 (10.75%) | 16.21 (12.01%) | 0.873 |
Daily DNI
| CAMS-Radiation -- DNI Quality assessment results vs. the stations DAILY IRRADIATION |
||||||
| Station | Number of values | Mean station (Wh/m2) |
Bias (Wh/m2) (relative in %) |
STDEV (Wh/m2) (relative in %) |
RMSE (Wh/m2) (relative in %) |
Correl. coeff. |
| Tataouine | 826 | 6607.35 | -880.29 (-13.32%) | 1224.20 (18.53%) | 1507.84 (22.82%) | 0.866 |
| Ma'an | 850 | 7764.08 | -852.41 (-10.98%) | 834.10 (10.74%) | 1192.61 (15.36%) | 0.936 |
| Oujda | 1099 | 6602.19 | -292.59 (-4.43%) | 844.85 (12.80%) | 894.09 (13.54%) | 0.931 |
| Cairo | 1184 | 5777.61 | 188.16 (3.26%) | 1061.29 (18.37%) | 1077.84 (18.66%) | 0.860 |
| Adrar | 585 | 6411.86 | -988.40 (-15.42%) | 1452.48 (22.65%) | 1756.88 (27.40%) | 0.791 |
| Ghardaia | 382 | 6787.80 | -1346.93 (-19.84%) | 1143.75 (16.85%) | 1767.03 (26.03%) | 0.853 |
| Missour | 808 | 6991.37 | -970.92 (-13.89%) | 1069.33 (15.29%) | 1444.35 (20.66%) | 0.881 |
| Erfoud | 1199 | 6755.98 | -366.71 (-5.43%) | 1012.70 (14.99%) | 1077.05 (15.94%) | 0.892 |
| Zagora | 1237 | 7241.83 | -649.44 (-8.97%) | 1202.67 (16.61%) | 1366.81 (18.87%) | 0.879 |
| Tan-Tan | 322 | 5657.47 | 356.40 (6.30%) | 1257.35 (22.22%) | 1306.88 (23.10%) | 0.799 |
Hourly DNI
| CAMS-Radiation -- DNI Quality assessment results vs. the stations HOURLY IRRADIATION |
||||||
| Station | Number of values | Mean station (Wh/m2) |
Bias (Wh/m2) (relative in %) |
STDEV (Wh/m2) (relative in %) |
RMSE (Wh/m2) (relative in %) |
Correl. coeff. |
| Tataouine | 10079 | 550.30 | -74.00 (-13.45%) | 159.00 (28.89%) | 175.38 (31.87%) | 0.854 |
| Ma'an | 10724 | 625.91 | -69.56 (-11.11%) | 113.78 (18.18%) | 133.36 (21.31%) | 0.932 |
| Oujda | 13396 | 558.13 | -24.90 (-4.46%) | 125.34 (22.46%) | 127.79 (22.90%) | 0.909 |
| Cairo | 13417 | 509.93 | 15.61 (3.06%) | 137.80 (27.02%) | 138.68 (27.20%) | 0.869 |
| Adrar | 7021 | 536.94 | -82.33 (-15.33%) | 162.11 (30.19%) | 181.82 (33.86%) | 0.840 |
| Ghardaia | 4526 | 582.65 | -117.22 (-20.12%) | 164.77 (28.28%) | 202.22 (34.71%) | 0.843 |
| Missour | 9641 | 612.52 | -87.10 (-14.22%) | 167.38 (27.33%) | 188.69 (30.80%) | 0.857 |
| Erfoud | 13737 | 591.91 | -32.27 (-5.45%) | 128.96 (21.79%) | 132.93 (22.46%) | 0.903 |
| Zagora | 14863 | 608.20 | -55.27 (-9.09%) | 142.57 (23.44%) | 152.91 (25.14%) | 0.895 |
| Tan-Tan | 4092 | 489.23 | 54.74 (11.19%) | 193.15 (39.48%) | 200.76 (41.04%) | 0.797 |
15 min DNI
| CAMS-Radiation -- DNI Quality assessment results vs. the stations 15 MIN IRRADIATION |
||||||
| Station | Number of values | Mean station (Wh/m2) |
Bias (Wh/m2) (relative in %) |
STDEV (Wh/m2) (relative in %) |
RMSE (Wh/m2) (relative in %) |
Correl. coeff. |
| Tataouine | 38936 | 142.99 | -18.83 (-13.17%) | 45.94 (32.13%) | 49.65 (34.72%) | 0.801 |
| Ma'an | 40821 | 165.14 | -18.33 (-11.10%) | 34.04 (20.61%) | 38.66 (23.41%) | 0.892 |
| Oujda | 52723 | 142.89 | -5.87 (-4.11%) | 39.16 (27.41%) | 39.60 (27.72%) | 0.859 |
| Cairo | 53227 | 130.38 | 4.16 (3.19%) | 39.81 (30.54%) | 40.03 (30.70%) | 0.829 |
| Adrar | 27463 | 137.79 | -20.90 (-15.17%) | 44.11 (32.01%) | 48.81 (35.43%) | 0.809 |
| Ghardaia | 17641 | 150.84 | -30.20 (-20.02%) | 46.24 (30.65%) | 55.23 (36.61%) | 0.800 |
| Missour | 37902 | 157.79 | -22.17 (-14.05%) | 50.50 (32.00%) | 55.15 (34.95%) | 0.795 |
| Erfoud | 53920 | 152.24 | -8.18 (-5.37%) | 38.81 (25.49%) | 39.66 (26.05%) | 0.856 |
| Zagora | 57388 | 158.24 | -14.13 (-8.93%) | 41.64 (26.32%) | 43.98 (27.79%) | 0.849 |
| Tan-Tan | 16367 | 123.62 | 16.02 (12.96%) | 56.45 (45.67%) | 58.68 (47.47%) | 0.738 |