
CAMS Rad - EnerMENA
Validation CAMS Radiation Service - EnerMENA stations |
Date of the validation: June 2021 Illustration: list of the EnerMENA stations used for the validation => |
|
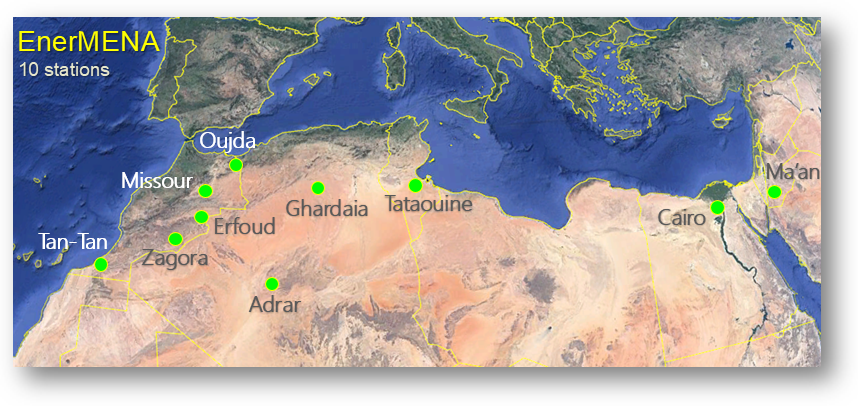
EnerMENA stations used in this validation
Table 1: in decreasing latitudes. "TS" stands for Thermal Sensors and "RSI" for Rotating Shadowband Irradiometer sensors.
| Station | Country | Station Type | Latitude (°) | Longitude (°) | Altitude (m) | Period | Climate |
| Oujda | Morocco | TS | 34.650 | -1.900 | 617 | 2015-01-06 to 2018-10-02 | Mediterranean |
| Tataouine | Tunisia | TS | 32.974 | 10.485 | 210 | 2014-12-31 to 2017-09-15 | Desertic |
| Missour | Morocco | TS | 32.860 | -4.107 | 1107 | 2015-01-01 to 2018-09-20 | Desertic - Montaneous |
| Ghardaia | Algeria | TS | 32.386 | 3.780 | 463 | 2014-12-31 to 2016-04-01 | Desertic |
| Erfoud | Morocco | RSI | 31.491 | -4.218 | 859 | 2015-01-24 to 2018-10-02 | Desertic |
| Zagora | Morocco | RSI | 30.272 | -5.852 | 783 | 2015-01-01 to 2018-10-01 | Desertic |
| Ma'an | Jordan | TS | 30.172 | 35.818 | 1012 | 2014-12-31 to 2018-01-22 | Desertic |
| Cairo | Egypt | TS | 30.036 | 31.009 | 104 | 2014-12-31 to 2018-09-14 | Desertic - Mediterranean |
| Tan-Tan | Morocco | TS | 28.498 | -11.322 | 75 | 2015-01-01 to 2016-12-02 | Desertic - Oceanic |
| Adrar | Algeria | TS | 27.878 | -0.270 | 262 | 2014-12-31 to 2018-03-29 | Desertic |
Interpretation of results
Most sites are located in desertic areas, in which an underestimation of the radiation is observed. The exception is the site of Tan-Tan, located close to the sea shore.
GHI and DNI CAMS Radiation validation results - monthly, daily, hourly and 15 min sampling rates
(Click on the following link to show the corresponding statistics)
Monthly GHI
|
CAMS-Radiation -- GHI Quality assessment results vs. the stations MONTHLY IRRADIATION |
||||||
| Station | Number of values | Mean station (kWh/m2) |
Bias (kWh/m2) (relative in %) |
STDEV (kWh/m2) (relative in %) |
RMSE (kWh/m2) (relative in %) |
Correl. coeff. |
| Oujda | 53 | 150.37 | -0.62 (-0.41%) | 4.48 (2.98%) | 4.52 (3.01%) | 0.997 |
| Tataouine | 40 | 160.19 | -6.61 (-4.12%) | 4.42 (2.76%) | 7.95 (4.96%) | 0.997 |
| Missour | 33 | 148.56 | -6.13 (-4.13%) | 2.72 (1.83%) | 6.71 (4.52%) | 0.999 |
| Ghardaia | 15 | 153.83 | -9.39 (-6.11%) | 6.21 (4.04%) | 11.26 (7.32%) | 0.995 |
| Erfoud | 53 | 164.42 | -0.34 (-0.21%) | 3.62 (2.20%) | 3.63 (2.21%) | 0.997 |
| Zagora | 53 | 174.19 | -2.61 (-1.50%) | 9.11 (5.23%) | 9.48 (5.44%) | 0.980 |
| Ma'an | 33 | 175.93 | -8.20 (-4.66%) | 3.20 (1.82%) | 8.80 (5.00%) | 0.999 |
| Cairo | 52 | 158.14 | -0.35 (-0.22%) | 4.86 (3.07%) | 4.87 (3.08%) | 0.996 |
| Tan-Tan | 16 | 135.92 | 4.18 (3.08%) | 8.16 (6.00%) | 9.17 (6.75%) | 0.972 |
| Adrar | 24 | 179.98 | -12.36 (-6.87%) | 5.18 (2.88%) | 13.40 (7.45%) | 0.995 |
Daily GHI
|
CAMS-Radiation -- GHI Quality assessment results vs. the stations DAILY IRRADIATION |
||||||
| Station | Number of values | Mean station (Wh/m2) |
Bias (Wh/m2) (relative in %) |
STDEV (Wh/m2) (relative in %) |
RMSE (Wh/m2) (relative in %) |
Correl. coeff. |
| Oujda | 1567 | 5102.56 | -21.71 (-0.43%) | 312.73 (6.13%) | 313.48 (6.14%) | 0.990 |
| Tataouine | 1164 | 5521.01 | -223.58 (-4.05%) | 328.98 (5.96%) | 397.77 (7.20%) | 0.987 |
| Missour | 952 | 5455.61 | -230.73 (-4.23%) | 313.09 (5.74%) | 388.92 (7.13%) | 0.987 |
| Ghardaia | 411 | 5566.88 | -340.36 (-6.11%) | 382.90 (6.88%) | 512.31 (9.20%) | 0.979 |
| Erfoud | 1545 | 5660.31 | -8.70 (-0.15%) | 282.86 (5.00%) | 282.99 (5.00%) | 0.985 |
| Zagora | 1556 | 5956.47 | -87.91 (-1.48%) | 409.39 (6.87%) | 418.72 (7.03%) | 0.970 |
| Ma'an | 982 | 6062.03 | -282.69 (-4.66%) | 271.53 (4.48%) | 391.97 (6.47%) | 0.991 |
| Cairo | 1498 | 5573.97 | -10.13 (-0.18%) | 304.05 (5.45%) | 304.22 (5.46%) | 0.987 |
| Tan-Tan | 481 | 4983.24 | 210.83 (4.23%) | 672.69 (13.50%) | 704.95 (14.15%) | 0.910 |
| Adrar | 724 | 6098.54 | -412.15 (-6.76%) | 430.42 (7.06%) | 595.93 (9.77%) | 0.965 |
Hourly GHI
| CAMS-Radiation -- GHI Quality assessment results vs. the stations HOURLY IRRADIATION |
||||||
| Station | Number of values | Mean station (Wh/m2) |
Bias (Wh/m2) (relative in %) |
STDEV (Wh/m2) (relative in %) |
RMSE (Wh/m2) (relative in %) |
Correl. coeff. |
| Oujda | 17103 | 469.85 | -2.04 (-0.43%) | 52.33 (11.14%) | 52.37 (11.15%) | 0.983 |
| Tataouine | 12917 | 499.91 | -20.37 (-4.07%) | 52.10 (10.42%) | 55.93 (11.19%) | 0.984 |
| Missour | 10514 | 501.83 | -21.36 (-4.26%) | 60.30 (12.02%) | 63.97 (12.75%) | 0.980 |
| Ghardaia | 4439 | 516.96 | -31.48 (-6.09%) | 51.10 (9.89%) | 60.02 (11.61%) | 0.984 |
| Erfoud | 16874 | 517.87 | -0.78 (-0.15%) | 50.28 (9.71%) | 50.29 (9.71%) | 0.985 |
| Zagora | 17383 | 535.34 | -7.96 (-1.49%) | 57.59 (10.76%) | 58.14 (10.86%) | 0.981 |
| Ma'an | 10842 | 552.14 | -25.85 (-4.68%) | 45.54 (8.25%) | 52.36 (9.48%) | 0.989 |
| Cairo | 16054 | 519.84 | -0.84 (-0.16%) | 48.15 (9.26%) | 48.16 (9.26%) | 0.987 |
| Tan-Tan | 5370 | 455.89 | 19.34 (4.24%) | 84.98 (18.64%) | 87.16 (19.12%) | 0.955 |
| Adrar | 8031 | 550.04 | -37.21 (-6.76%) | 56.00 (10.18%) | 67.24 (12.22%) | 0.982 |
15 min GHI
|
CAMS-Radiation -- GHI Quality assessment results vs. the stations 15 MIN IRRADIATION |
||||||
| Station | Number of values | Mean station (Wh/m2) |
Bias (Wh/m2) (relative in %) |
STDEV (Wh/m2) (relative in %) |
RMSE (Wh/m2) (relative in %) |
Correl. coeff. |
| Oujda | 64314 | 125.25 | -0.54 (-0.43%) | 18.21 (14.54%) | 18.22 (14.55%) | 0.965 |
| Tataouine | 48066 | 134.60 | -5.48 (-4.07%) | 17.42 (12.94%) | 18.26 (13.57%) | 0.968 |
| Missour | 39362 | 135.55 | -5.86 (-4.32%) | 20.54 (15.15%) | 21.36 (15.76%) | 0.960 |
| Ghardaia | 16572 | 139.24 | -8.50 (-6.11%) | 16.29 (11.70%) | 18.38 (13.20%) | 0.970 |
| Erfoud | 63172 | 138.71 | -0.24 (-0.17%) | 17.32 (12.49%) | 17.32 (12.49%) | 0.965 |
| Zagora | 64918 | 143.67 | -2.15 (-1.49%) | 19.13 (13.31%) | 19.25 (13.40%) | 0.960 |
| Ma'an | 40578 | 148.03 | -6.95 (-4.69%) | 14.93 (10.09%) | 16.47 (11.13%) | 0.977 |
| Cairo | 60634 | 138.93 | -0.25 (-0.18%) | 16.49 (11.87%) | 16.49 (11.87%) | 0.972 |
| Tan-Tan | 20112 | 122.28 | 5.16 (4.22%) | 24.99 (20.44%) | 25.52 (20.87%) | 0.933 |
| Adrar | 30146 | 147.14 | -9.96 (-6.77%) | 16.91 (11.49%) | 19.62 (13.34%) | 0.969 |
Monthly DNI
|
CAMS-Radiation -- DNI Quality assessment results vs. the stations MONTHLY IRRADIATION |
||||||
| Station | Number of values | Mean station (kWh/m2) |
Bias (kWh/m2) (relative in %) |
STDEV (kWh/m2) (relative in %) |
RMSE (kWh/m2) (relative in %) |
Correl. coeff. |
| Oujda | 53 | 162.47 | -0.89 (-0.55%) | 7.85 (4.83%) | 7.90 (4.87%) | 0.976 |
| Tataouine | 40 | 170.33 | -13.26 (-7.79%) | 10.46 (6.14%) | 16.89 (9.92%) | 0.975 |
| Missour | 33 | 164.03 | -10.20 (-6.22%) | 8.60 (5.24%) | 13.34 (8.13%) | 0.972 |
| Ghardaia | 15 | 169.97 | -17.26 (-10.15%) | 13.32 (7.84%) | 21.80 (12.82%) | 0.953 |
| Erfoud | 53 | 181.23 | -3.22 (-1.77%) | 15.24 (8.41%) | 15.57 (8.59%) | 0.902 |
| Zagora | 53 | 192.72 | -5.41 (-2.81%) | 18.80 (9.76%) | 19.57 (10.15%) | 0.889 |
| Ma'an | 33 | 205.64 | -19.62 (-9.54%) | 11.65 (5.66%) | 22.81 (11.09%) | 0.980 |
| Cairo | 52 | 151.94 | 10.22 (6.73%) | 13.39 (8.81%) | 16.84 (11.09%) | 0.963 |
| Tan-Tan | 16 | 112.64 | 26.76 (23.76%) | 22.49 (19.97%) | 34.96 (31.04%) | 0.778 |
| Adrar | 24 | 152.58 | 5.97 (3.91%) | 64.30 (42.14%) | 64.57 (42.32%) | 0.119 |
Daily DNI
|
CAMS-Radiation -- DNI Quality assessment results vs. the stations DAILY IRRADIATION |
||||||
| Station | Number of values | Mean station (Wh/m2) |
Bias (Wh/m2) (relative in %) |
STDEV (Wh/m2) (relative in %) |
RMSE (Wh/m2) (relative in %) |
Correl. coeff. |
| Oujda | 1567 | 5501.07 | -26.85 (-0.49%) | 707.19 (12.86%) | 707.70 (12.86%) | 0.967 |
| Tataouine | 1164 | 5867.00 | -448.13 (-7.64%) | 883.61 (15.06%) | 990.75 (16.89%) | 0.943 |
| Missour | 952 | 6036.69 | -377.97 (-6.26%) | 837.16 (13.87%) | 918.53 (15.22%) | 0.950 |
| Ghardaia | 411 | 6151.82 | -625.11 (-10.16%) | 965.87 (15.70%) | 1150.50 (18.70%) | 0.915 |
| Erfoud | 1545 | 6241.68 | -107.89 (-1.73%) | 954.13 (15.29%) | 960.21 (15.38%) | 0.913 |
| Zagora | 1549 | 6621.09 | -184.40 (-2.79%) | 1118.20 (16.89%) | 1133.30 (17.12%) | 0.895 |
| Ma'an | 983 | 7067.09 | -671.37 (-9.50%) | 828.59 (11.72%) | 1066.44 (15.09%) | 0.950 |
| Cairo | 1499 | 5349.19 | 368.15 (6.88%) | 1002.56 (18.74%) | 1068.02 (19.97%) | 0.898 |
| Tan-Tan | 481 | 3997.79 | 1104.53 (27.63%) | 1492.40 (37.33%) | 1856.67 (46.44%) | 0.843 |
| Adrar | 724 | 5036.49 | 348.97 (6.93%) | 2727.02 (54.15%) | 2749.26 (54.59%) | 0.513 |
Hourly DNI
|
CAMS-Radiation -- DNI Quality assessment results vs. the stations HOURLY IRRADIATION |
||||||
| Station | Number of values | Mean station (Wh/m2) |
Bias (Wh/m2) (relative in %) |
STDEV (Wh/m2) (relative in %) |
RMSE (Wh/m2) (relative in %) |
Correl. coeff. |
| Oujda | 17129 | 506.00 | -2.54 (-0.50%) | 110.92 (21.92%) | 110.95 (21.93%) | 0.943 |
| Tataouine | 12924 | 530.97 | -40.76 (-7.68%) | 129.40 (24.37%) | 135.67 (25.55%) | 0.916 |
| Missour | 10520 | 554.65 | -34.73 (-6.26%) | 133.72 (24.11%) | 138.16 (24.91%) | 0.927 |
| Ghardaia | 4440 | 570.31 | -57.76 (-10.13%) | 122.68 (21.51%) | 135.60 (23.78%) | 0.924 |
| Erfoud | 16883 | 569.94 | -9.74 (-1.71%) | 126.17 (22.14%) | 126.54 (22.20%) | 0.919 |
| Zagora | 17343 | 594.55 | -16.87 (-2.84%) | 139.66 (23.49%) | 140.67 (23.66%) | 0.904 |
| Ma'an | 10907 | 641.19 | -61.11 (-9.53%) | 119.69 (18.67%) | 134.38 (20.96%) | 0.926 |
| Cairo | 16071 | 498.14 | 34.16 (6.86%) | 136.71 (27.44%) | 140.92 (28.29%) | 0.889 |
| Tan-Tan | 5373 | 365.34 | 100.66 (27.55%) | 184.99 (50.63%) | 210.60 (57.65%) | 0.851 |
| Adrar | 8038 | 454.54 | 30.30 (6.67%) | 282.62 (62.18%) | 284.23 (62.53%) | 0.617 |
15 min DNI
|
CAMS-Radiation -- DNI Quality assessment results vs. the stations 15 MIN IRRADIATION |
||||||
| Station | Number of values | Mean station (Wh/m2) |
Bias (Wh/m2) (relative in %) |
STDEV (Wh/m2) (relative in %) |
RMSE (Wh/m2) (relative in %) |
Correl. coeff. |
| Oujda | 64414 | 134.88 | -0.67 (-0.50%) | 34.82 (25.82%) | 34.83 (25.82%) | 0.909 |
| Tataouine | 48086 | 142.91 | -10.92 (-7.64%) | 39.32 (27.52%) | 40.81 (28.56%) | 0.869 |
| Missour | 39400 | 149.97 | -9.50 (-6.33%) | 41.64 (27.76%) | 42.71 (28.48%) | 0.886 |
| Ghardaia | 16576 | 153.81 | -15.62 (-10.15%) | 36.39 (23.66%) | 39.60 (25.75%) | 0.884 |
| Erfoud | 63196 | 152.87 | -2.68 (-1.76%) | 37.88 (24.78%) | 37.97 (24.84%) | 0.874 |
| Zagora | 64773 | 159.78 | -4.60 (-2.88%) | 41.39 (25.90%) | 41.64 (26.06%) | 0.853 |
| Ma'an | 40782 | 171.90 | -16.41 (-9.54%) | 35.80 (20.82%) | 39.38 (22.91%) | 0.880 |
| Cairo | 60689 | 133.38 | 9.12 (6.84%) | 40.10 (30.06%) | 41.12 (30.83%) | 0.834 |
| Tan-Tan | 20121 | 98.06 | 26.97 (27.50%) | 52.46 (53.50%) | 58.99 (60.16%) | 0.817 |
| Adrar | 30158 | 121.43 | 8.42 (6.94%) | 75.51 (62.18%) | 75.97 (62.57%) | 0.552 |
Validation of previous versions of CAMS Radiation Service:
Validation of CAMS Radiation Service 3.2 against 10 EnerMENA stations (May 2019)